 Plot Data by Record/Plot Data by Field Plot Data by Record/Plot Data by Field
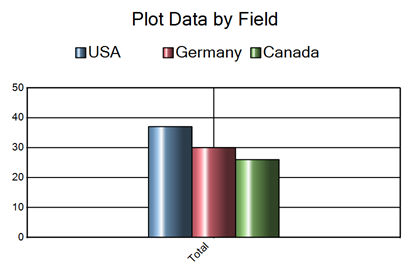
By default, the Charting tool plots data by record. Some chart types support the option to plot data by field. The Plot Data property is set from the Legend, Data Layout panel in the Charting tool. Look at the example below.
Incoming data looks like:


The Plot Data by Field option is only available for the following chart types: Area, Bar, Column, Line, Stacked Area, Stacked Bar, Stacked Column, and Radar.
Note: The Radar chart type must have at least three valid series before the By Field option becomes available. This is because the "plot by" parts (records or fields) determine the "containing axis", which must be a polygon, and therefore cannot have less than three points.
The Plot Data by Field option is not available for the following chart types: Scatter, Bubble, Pie, Tornado, Pareto, Polar, Combination, and Box and Whisker.
©2018 Alteryx, Inc., all rights reserved. Allocate®, Alteryx®, Guzzler®, and Solocast® are registered trademarks of Alteryx, Inc.