Review Column Statistics
Designer Cloud retains real-time statistics on the data in individual columns in the Transformer page and, when a job is executed, can deliver detailed statistics as part of the output.
Column Statistics in the Transformer Page
In the Transformer page, you can access statistics on individual columns through the data grid or Column Browser.
Nota
All statistics in the Transformer page reference the currently displayed sample. If the sample is not the entire dataset, then these statistics may not accurately statistics of your generated results.
Statistics in the data grid
At the top of each column, you can see a visual representation of the data quality and histogram of values in the column.
Data quality bar: This horizontal bar indicates the comparative volumes of valid values (green), invalid values (red), and missing values (black).
Column histogram: You can see the distribution of values within the column, as indicated by the height of individual columns.
Sugerencia
Mouse over any bar to see the number and percentage of a value in the sampled column.
Sugerencia
You can select one or more of these bars to prompt for suggestions on how to transform the data.
For more information, see Find Bad Data.
Statistics in Column Details
In the Transformer toolbar, select a column. From the column menu, select Details. In Column Details, you can explore additional statistics derived from the values in the column for the currently selected sample.
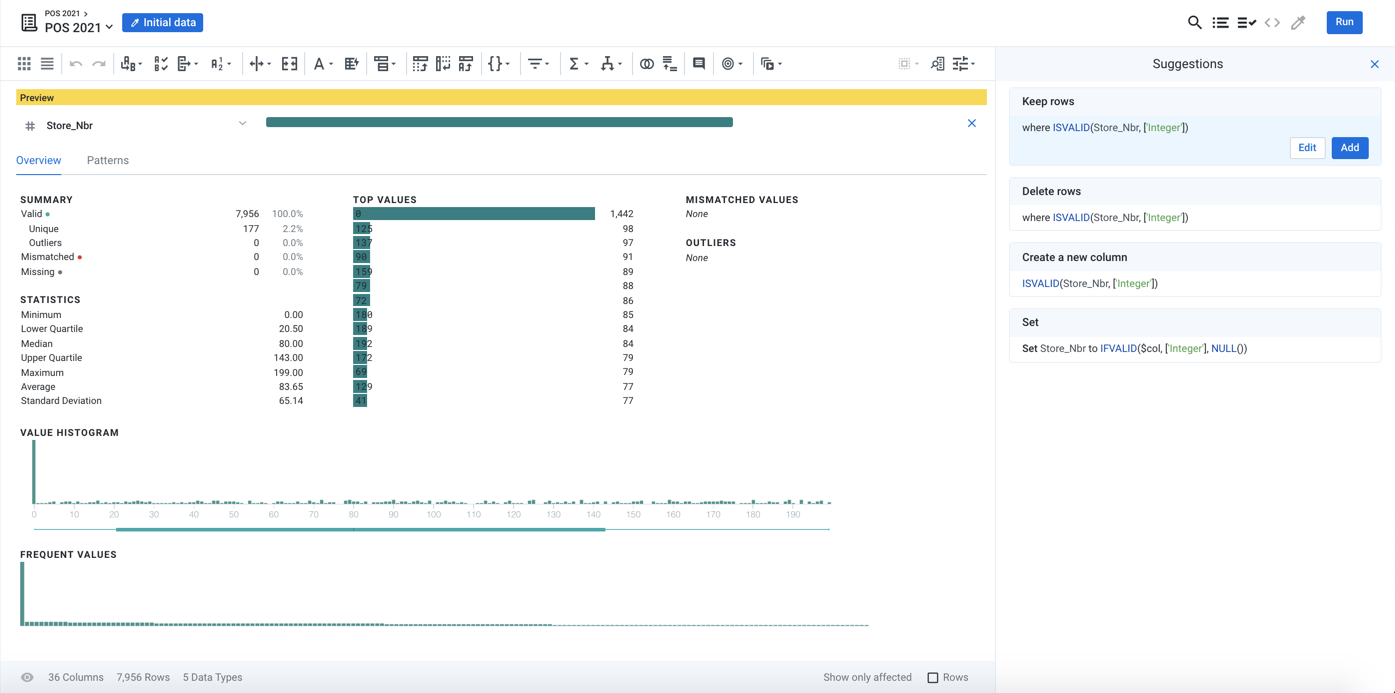
Figure: Column Details panel
The statistics displayed in the Column Details vary depending on the column data type. For example, numeric metrics appear for Integer and Decimal columns, and fewer of them appear for columns of String type.
Sugerencia
Selecting one or more bars in the Column Details panel prompts for a set of suggested transformations.
Sugerencia
You may wish to explore the Patterns tab where you can review patterns in the data and to make transformations based on them.
Column Statistics in Transformations
You can also generate statistics for your dataset at any point time during recipe development.
Nota
The values computed by these metrics in the Transformer page apply only to the displayed sample. Values are computed across the entire dataset when a job is run.
Flat Aggregations
As a transformation step, you can perform custom aggregated calculations on your dataset. For example, you can compute the average of all values in a column and add that as a new column.
Aggregations
You can also create aggregations that group computations by specified value. These computations provide deeper insights into your data.
Sugerencia
For exploratory calculations, you might choose to create a secondary recipe after your current one. In the secondary recipe, you perform these calculations, allowing you to continue to work in the first one on performing your primary transformations.
For more information, see Create Aggregations.
Column Statistics in Results
When you generate results, you can choose to generate a visual profile of your output data, which is delivered alongside the results that you specify.
A visual profile is visual representation of column and dataset statistics on the output.
Visual profiles can provide clues to continuing issues in the data and to overall trends.
Visual profiles are available in the application and can be downloaded in PDF or JSON format.
When enabled, a visual profile job is executed after the results have been generated.
To generate a visual profile, click the Profiling checkbox in the Run Job page.
When the job is complete, your visual profile is available in the Profile tab of the Job Details page.
For more information, see Overview of Visual Profiling.