Measures in Auto Insights
Now that you've uploaded your dataset and identified your key measure columns, these additional configurations will make your dataset ready for business use.
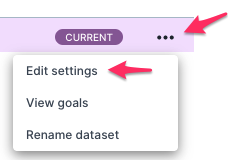
Go to the Datasets page. Find the Dataset to configure, then select the ellipsis icon > Edit settings.

Select Measures to open Measures settings.

Calculations
Simple Average
All measures have a simple average calculated automatically. For example, if you have a column 'sales,' Auto Insights calculates 'average sales' alongside with 'average sales per customer' and other complex averages. Simple averages appear at the bottom of the measure list in Search and Missions by default. You can hide and rearrange them like measures and complex averages.
Sum and Complex Average
You can select Sum and AverageCalculations options on the Measures page. Define the required calculations for each measure and turn off any that are not relevant.
Here's an example of automatic calculations Auto Insights performs with sales data—Department and Team segments:
An aggregated value of Sales based on the time period the user selects.
An average across each Segment (for example,Average Sales per Department, Average Sales per Team).
A simple average of each measure—total sales divided by the number of rows.
This makes sense, but sometimes there might be measures where it doesn't make sense to be aggregated or to have an average across segments. Some examples are Bank Balance and Net Promoter Score. *If you need to show a trend of such measures for your use case, reach out to the Auto Insights team for assistance.
To keep some average calculations and not all (for example, 'Average Sales per Department' is useful, but 'Average Sales per Gender' is not), you can select which ones you want to display. Read here to find out more about setting up key measures.
Units
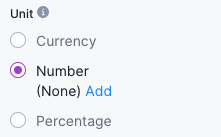
You can also add prefix and suffix units to your measures. The Percentage option defaults to suffix only.

Relevant Dates
Within your use case, there might be a few different dates in the dataset relevant to only specific measures (for example, Open Incident Count wouldn't have a Closed Date).
In the Measures configuration, you have the option to switch off dates that are not relevant for analysis. This helps to remove any confusion when users self-serve and want to select different dates to analyze.
