Get Started with Auto Insights
Welcome to Auto Insights. Use this page to help you get started. You can also go to the Alteryx Academy for more get-started videos, guides, and resources.
Nota
Auto Insights now includes a redesigned experience with simpler navigation and clearer entry points. To learn more, go to What’s Changed in Auto Insights.
Bring Your Data into Auto Insights
To start exploring insights, you can bring your data to Auto Insights in 2 ways: upload your data from Designer with the Auto Insights Uploader Tool or import your data from Alteryx One.
Dataset Requirements
At least 1 segment column (formatted as string/text) is required to enable "What caused this?" and other automated analysis.
Remove free text or unstructured data columns (data longer than 256 characters will be truncated)
Segment values (string data) can contain any characters supported by Unicode/UTF-8 encoding.
Column names must...
Have no duplicates.
Be included as the first row of data.
Have no more than 128 characters (column names longer will be truncated).
Recommendations
In addition to the requirements, we recommend you use a dataset with:
At least 1 number column.
At least 5 segment columns (formatted as string/text) to provide rich results in "What caused this?" and other automated analysis.
Data spanning at least 24 months.
The recommendations are just suggestions. Even if your data lacks these attributes, you can still use Auto Insights successfully.
For more information on how to prepare and upload your data, see Prepare Data and Import Data from Alteryx One articles.
Auto Insights Home Page
Use the Auto Insights Home page to access key features:
Preset Reports: The best place to find, create, and subscribe to insights for specific areas and items in your dataset.
Explore Data Insights: Search for insights in your data from the Auto Insights Home page.
Library: View your datasets and switch between datasets.
AI-Suggested Use Cases: Start an AI-Suggested Use Cases from the Auto Insights Home page.
Custom Reports: Create actionable reports using our end-to-end, flexible, AI-infused solution for reporting.
Help Center: Easy access to all help resources.
Profile: Access Account Settings and Sign Out.
Preset Reports
The Preset Reports page is the best place to find and create in-depth insights about any areas within your dataset.
On your Preset Reports page, you can view all the Preset Reports you have access to, search a Preset Reports by name, or filter the list of Preset Reports by datasets used in the Preset Reports. You can also save, collaborate, and subscribe to Preset Reports to monitor updates on an ongoing basis.
Create a Preset Report
To create a Preset Report, select Create new > Preset Report from the Auto Insights Home page.
Select 1 of the template options: KPI Deep Dive Analysis, Key Metrics Overview, Correlation Analysis, or Create Blank Canvas.
Add, Edit, and Delete Pages in Preset Reports in Edit Mode
To enter edit mode, select Edit.
Here you can add, duplicate, edit, and remove pages.
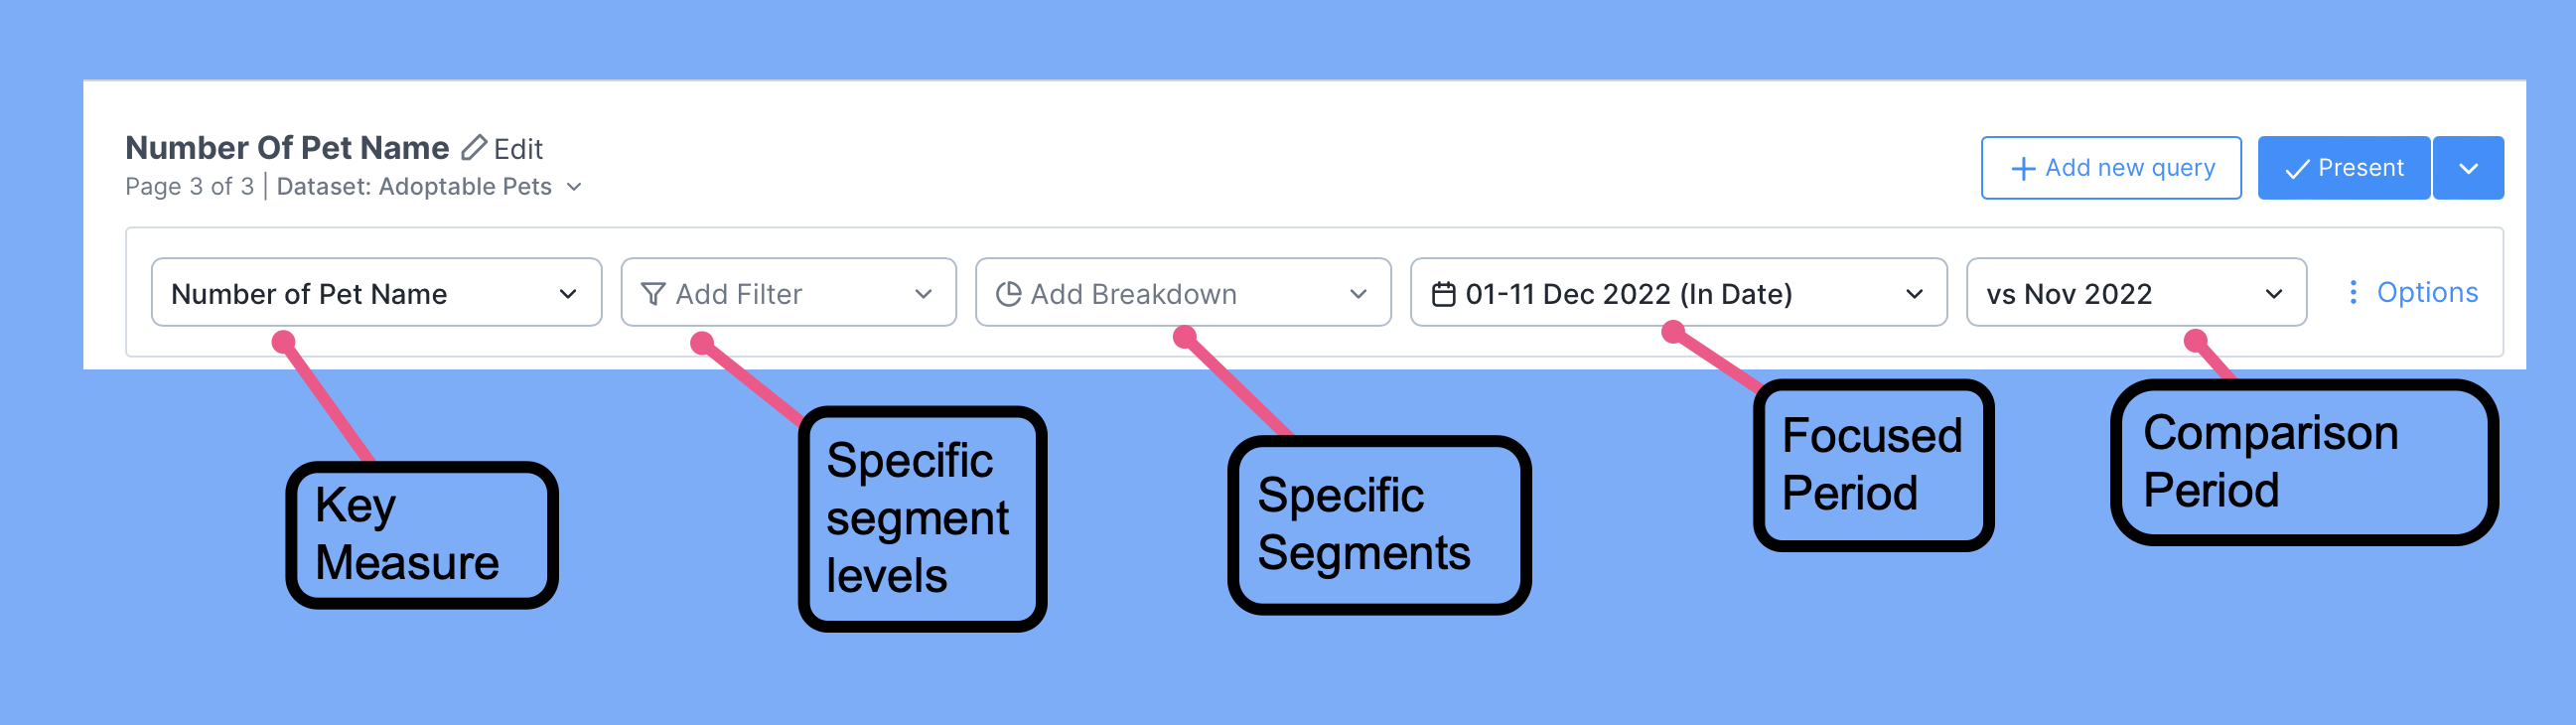
Query Bar
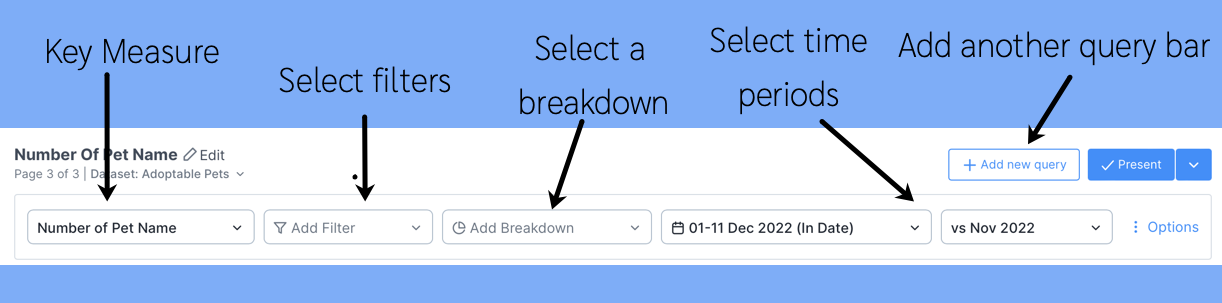
You can change the comparison period to compare against the previous month or the same month last year. Refer to this article on Time Period comparison for details.
Trend Over Time
Scroll down or select Overview. Auto Insights highlights the latest month-on-month change in purple. Drag the time scale slider underneath the graph to see the trend over a longer period to identify peaks and troughs.
Changing Dates
Our standard default week commences on a Sunday. If that’s not how your organization's reporting is, you have the flexibility to amend it. Read here for more information.
What Caused This
Easily explore and understand the contributing factors of change for each measure. To learn more about What Caused This methodology and explanation, refer to this article. To focus your analysis on a specific breakdown, select the ellipsis on the right to view trends over time. If you want to compare across all, select Drill down to get that comparison.
Dataset
Use the Dataset page to review and configure your your Auto Insights datasets.
For more information, see Manage Dataset.
AI Suggested Use Cases
AI Suggested Use Cases use generative Artificial Intelligence (AI) to help identify analytical use cases tailored to your custom scenario, generate a synthetic dataset based on your selected use case, and explore reports mapped to your department goals.
For more information, go to Find Insights.
Custom Reports
Auto Insights Custom Reports is an end-to-end, flexible, AI-infused solution for reporting. Reports combine the flexibility of an advanced editor with the power of automated analysis and the intelligence of AI.
Nota
Auto Insights Reports is new and improving, and is currently in Public Preview.
The Power of Automated Insights: Surface what’s happened in your business, why it’s happening, and what relevant stories exist within your data – refreshed automatically with your data.
The Flexibility of an Advanced Editor: Author analytics reports with an advanced editor that enables reporting flexibility and precision for your audience.
The Intelligence of AI: Use AI Assistance to generate insightful commentaries and executive summaries, giving you up-to-date information without manual intervention.
For more information, go to Custom Reports.