Preset Reports
A Preset Report is a consolidation of insights. You can set up email notifications to receive up-to-date insights once data is refreshed. Then, share those insights with your colleagues and stakeholders so that everyone is aligned.
These are some processes where Preset Reports are very useful:
Weekly Standups—To discuss what's happened in the past week, and areas to focus on and work on.
Monthly Management Meetings—To identify action items and decisions for management to make.
Ad hoc Requests—Businesses have specific questions on areas they want insights on.
Coaching—Specific performance of individuals to be used in 1:1s.
To create best-in-class Preset Reports, have an idea of what process you're using the Preset Report for and some idea of measures (for example, Revenue, Number of Clients, Number of Claims, or Expenses) you're focusing on.
Questions To Ask Yourself When Creating a Preset Report
What kind of measures do I need for continuous monitoring to validate a hypothesis? For example, I need to monitor my team's performance to find coaching opportunities. Or, there has been a decline in sales for a specific product. What's happening there?
Is there a reporting cadence I need to set up for my Preset Reports? For example, I have a weekly meeting with my team or a monthly management review to prepare in advance.
Who is my target audience for this Preset Report? It's only for me to monitor any outliers and anomalies. Or, it's for my stakeholders for their weekly meetings and monthly presentations.
プリセットレポートの作成
プリセットレポートは手動で作成することも、テンプレートを使用して作成することもできます。
プリセットレポートを作成するには、Auto Insightsホームページから[新規作成]を選択し、[プリセットレポート]を選択します。
次のテンプレートオプションから1つ選択します: 主な指標の概要、KPI詳細分析レポート、相関分析レポート、または空白のキャンバスを作成。
KPI詳細分析: データセットを確認または選択し、測定値を選択します。次に、[プリセットレポートの作成]を選択します。Auto Insightsが新しいプリセットレポートに日時付きで名前を作成します。これは、[プリセットレポートサマリー]ページで変更できます。
主な指標の概要: データセットを確認または選択し、[プリセットレポートの作成]を選択します。Auto Insightsが新しいプリセットレポートに日時付きで名前を作成します。これは、[プリセットレポートサマリー]ページで変更できます。
相関分析: データセットを確認または選択し、2つの測定値を選択します。次に、[プリセットレポートの作成]を選択します。Auto Insightsが新しいプリセットレポートに日時付きで名前を作成します。これは、[プリセットレポートサマリー]ページで変更できます。
注記
データセットに時系列データが含まれていない場合、相関分析は動作しません。
ゼロから構築するには、[空白のキャンバスを作成]を選択します。使用可能な列から適切な計算タイプ(合計、平均、またはカウント)を選択し、1つ以上の測定値を設定してプリセットレポートを作成するか、[平均の基準]ドロップダウンを使用して[複合平均]を選択します。次に、[プリセットレポートの作成]を選択します。
[プリセットレポートの作成]を選択すると、[プリセットレポートサマリー]ページが表示され、すべてのインサイトが表示されます。プリセットレポートの編集に関する詳細については、 Edit Preset Reportsページを参照してください。時系列データが含まれていないデータセットを使用する場合、変更分析は使用できません。
Preset Report Summary
Upon creating a Preset Report, you land on the summary page. This page is auto-created and overviews all the pages within a single Preset Report. As you build your Preset Report pages, more tiles (sections) display on the summary page. When you set a subscription schedule, Auto Insights sends this summary page to your email.
ヒント
Use the Jump-to-Page dropdown at the center of the navigation bar to quickly switch between pages of your Preset Report.
Expand and Collapse Your View
By default, your Preset Report Summary page shows sections expanded. To quickly scan the summary and decide if you want to explore specific sections in detail, switch to a collapsed view. To do so, select Expanded > Collapse all pages in the top navigation bar.
注記
This does not change the format of your subscription email. It still displays as expanded.
Totals vs Change
Whenever we interact with data, there are 2 main types of analysis that we want to uncover—we want to understand the changes compared to the previous period and know within that period what's contributing to the numbers.
Total
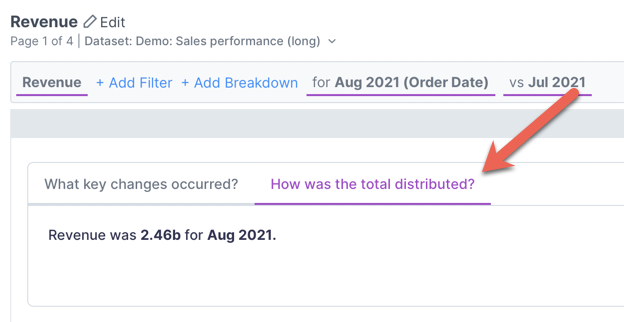
Select the How was the total distributed? tab to have Auto Insights focus on just proportion and disregard insights related to change over time.
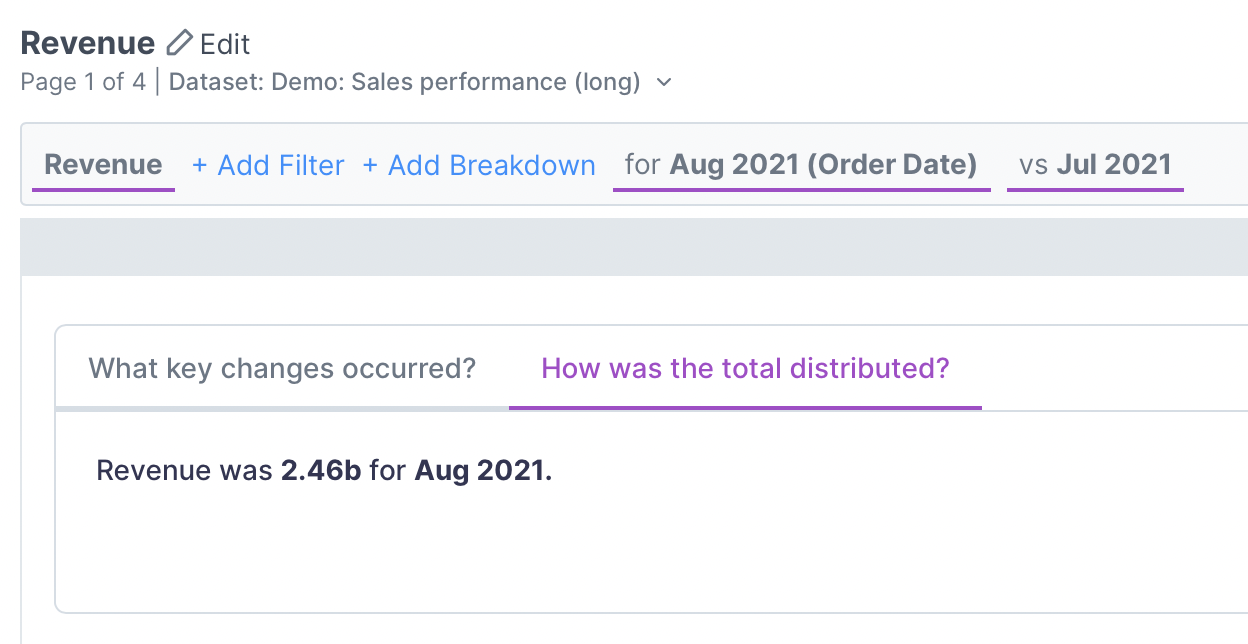
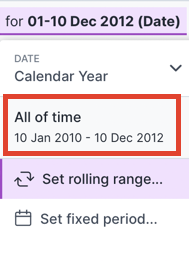
You can further customize this type of insight by removing the time comparison period or selecting All of time.
 |
Change
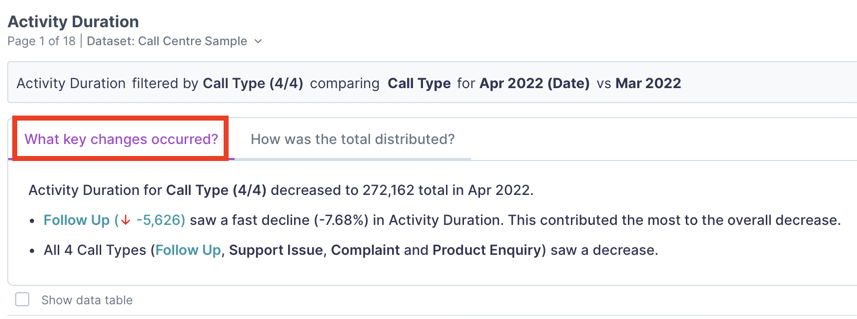
Select the What key changes occurred? tab to have Auto Insights explain the changes that happened. Note: The changes tab is unavailable if you use a dataset without time series data.
 |
Change the Time Comparison Period
Change the time period comparison, and add filters or breakdowns to curate Auto Insights' analysis further. You can change the comparison period to compare against the previous month or the same month last year. Refer to this article on Time Period comparison for details.
Totals Tables
Use Total Tables to provide more context for the Totals you see on your Preset Report page.
To view totals tables on your Preset Report page:
Go to the Auto Insights Home page.
Select the Preset Report you want to update.
From the Preset Report's Summary Page, select Edit.
Select a page to edit.
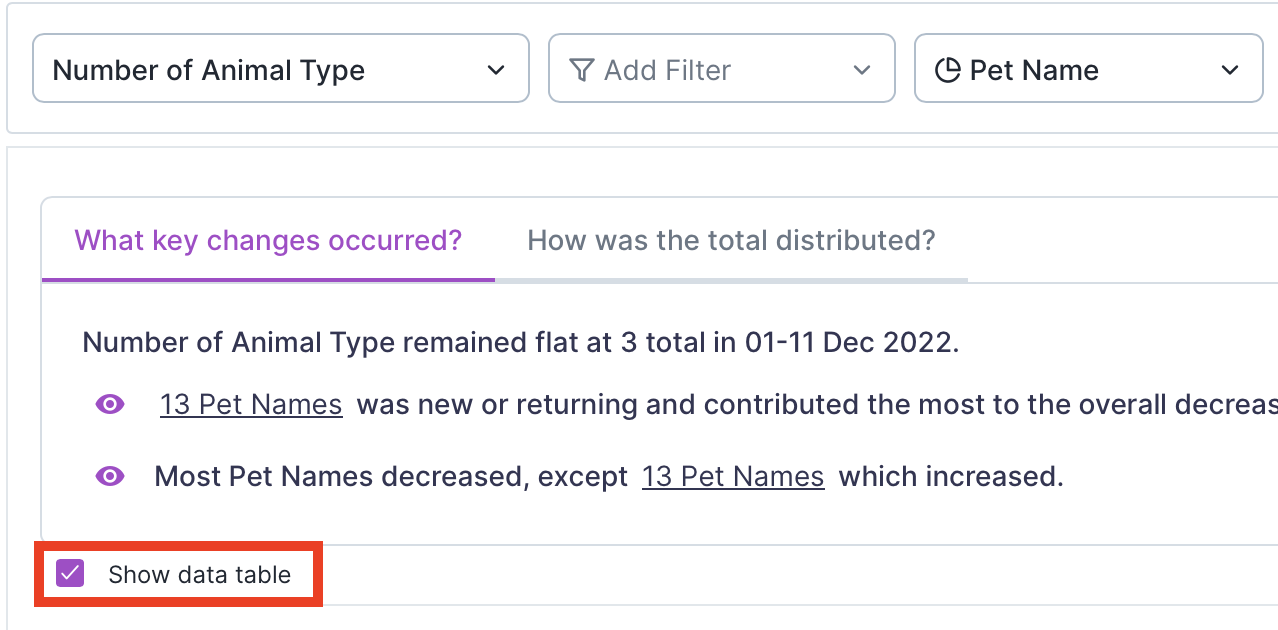
Select How was the total distributed?
Make sure you've selected a breakdown (segment), or select + Add Breakdown now.
Now a Show data table check box displays. Check the box to display a table nested under its respective page.
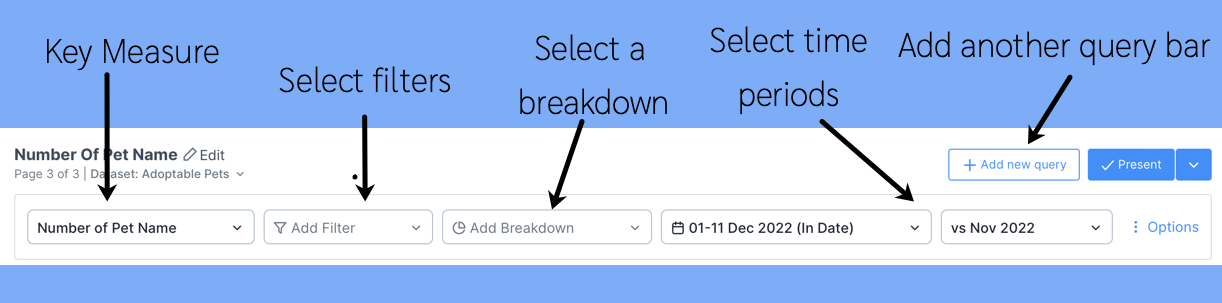
Query Bar
Each page has a query bar that provides the focus of analysis for that specific page. Use this query bar to get Auto Insights to search for insights on a specific area. Add another query bar to analyze the relationship between 2 different metrics. Learn more about the query bar in the Edit Missions article.
注記
Time period selection is unavailable if you use a dataset without time series data.
 |
Some Considerations for Interacting with the Query Bar
Do I want Auto Insights to tell me where to focus? For example, I'm not sure which segment I should break down by. Things constantly change each month.
If this is what you need each month, let Auto Insights do the work and identify the most significant contributing factors that cause the change. You should leave the filter and breakdown blank in this scenario. This way, Auto Insights calculates the most significant contributing factors and displays them in descending order.
OR
I know that I need to focus on a specific area. For example:
I need to only look at my team's performance. I'm not interested in other teams.
I need to only focus on my product. I'm not interested in other products.
In this scenario, you should add filters to your query—for example, Team 6.
OR
I know that I want to compare across a segment (dimension).
I need to understand movement across all teams.
I need to know how my product is performing against other products.
In this scenario, you should add breakdowns to your query—for example, Team.
Present Your Preset Report
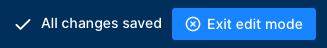
Select Exit edit mode to return to the presentation view.
 |