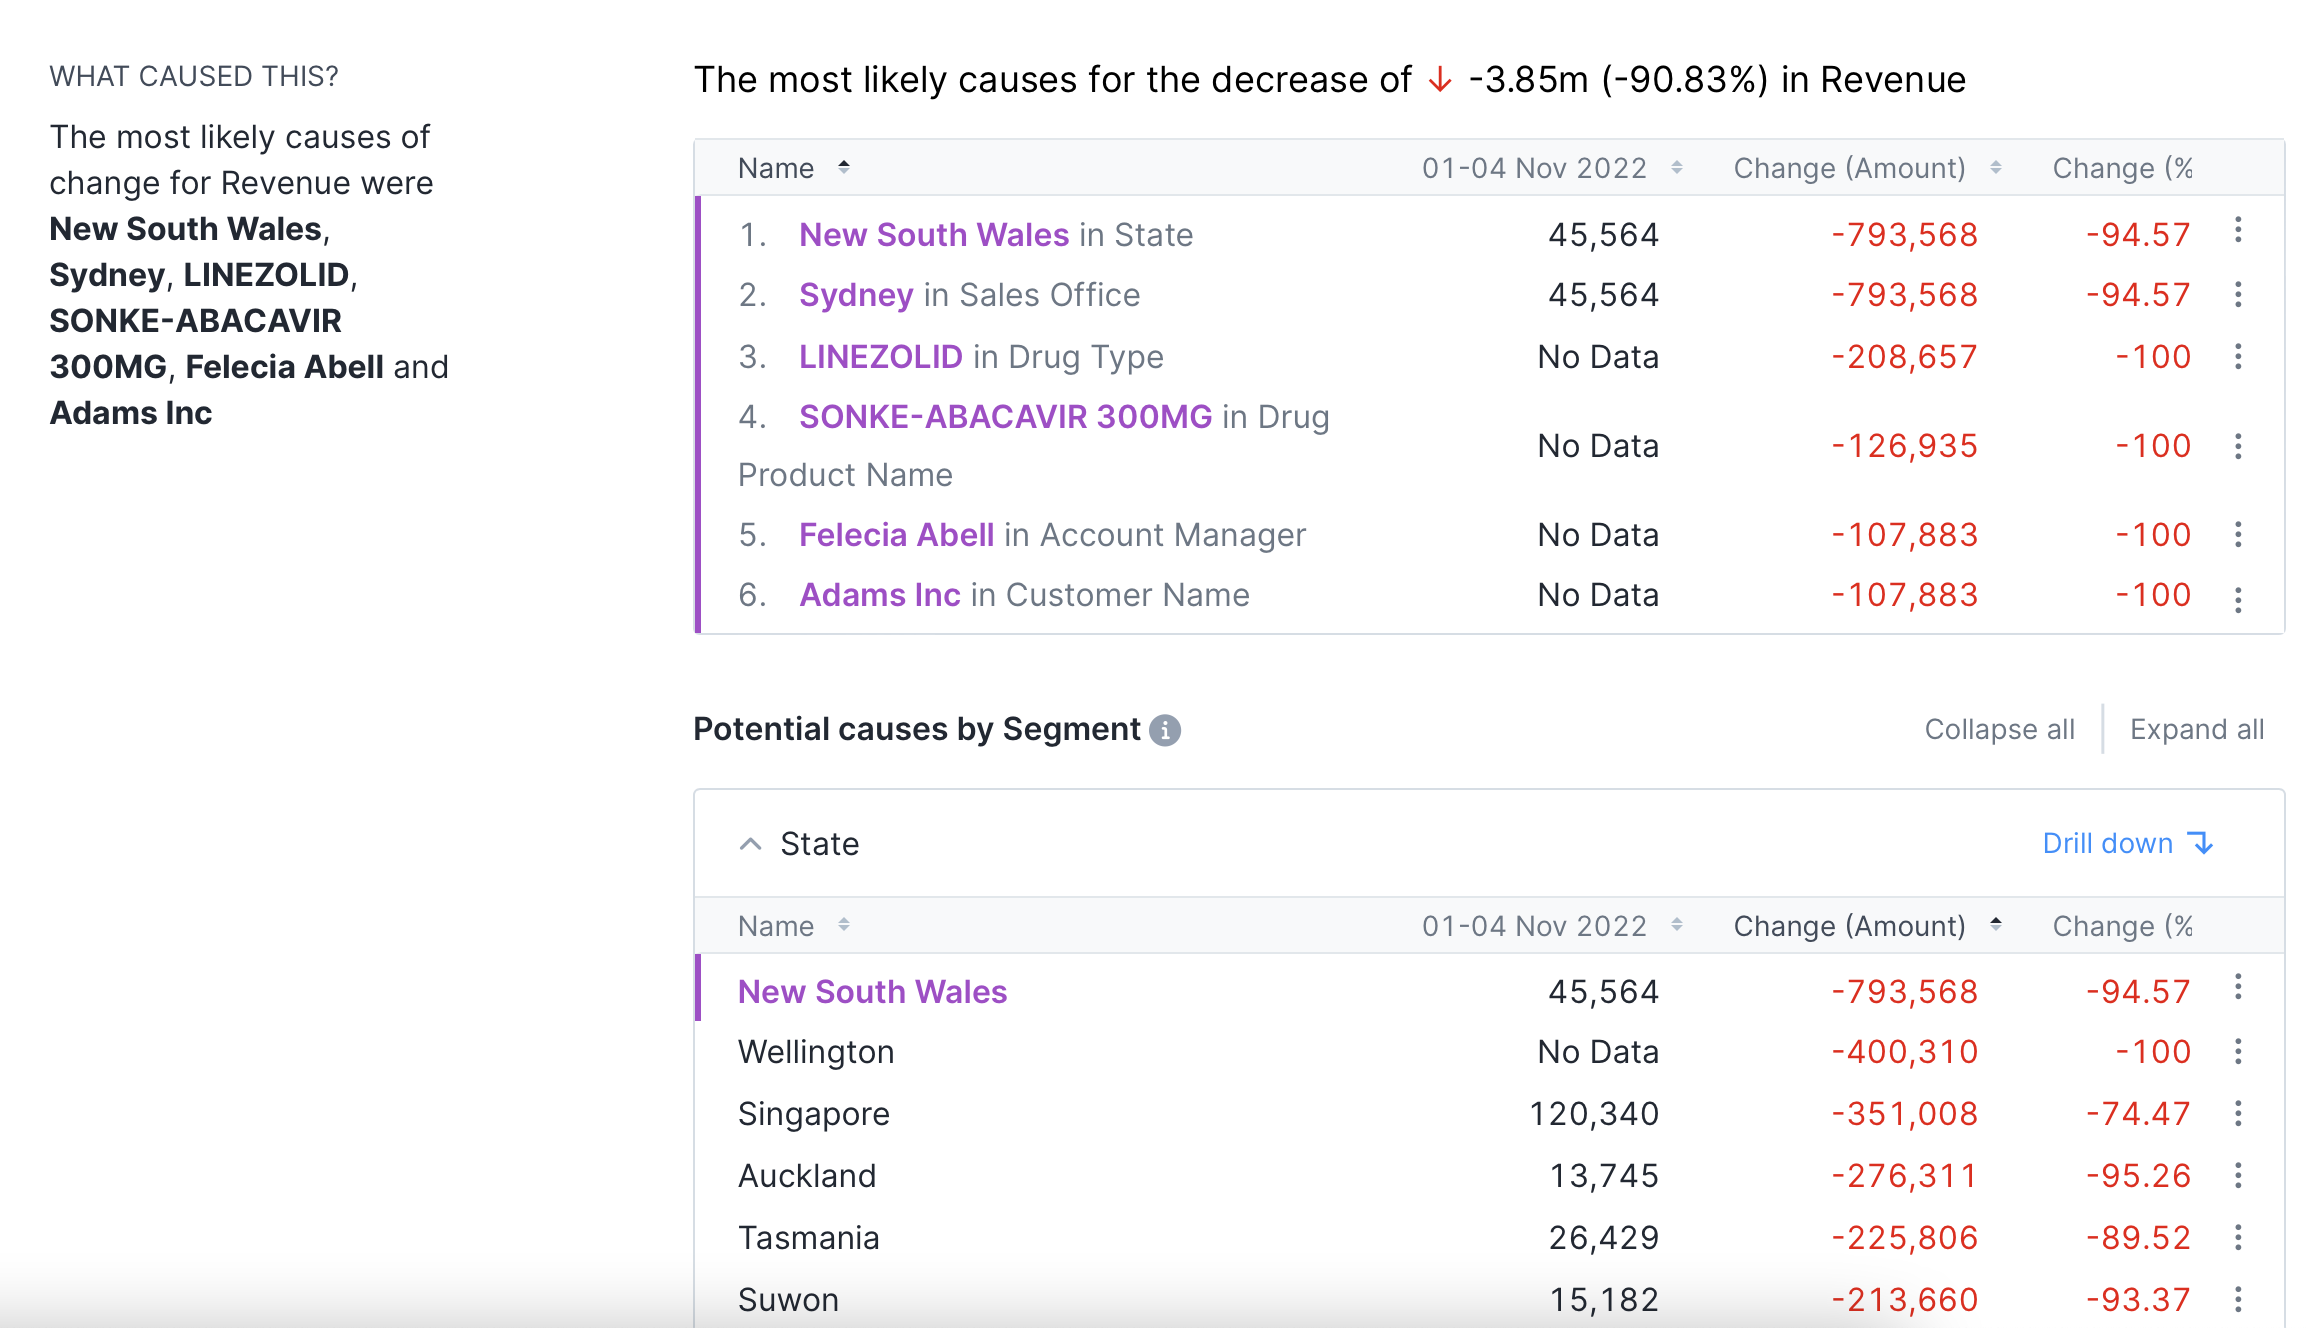
What Caused This
What Caused This uses machine learning and statistical methods to automate the process of identifying root causes of change.
Example Output
Auto Insights identifies the top 6 most likely causes for Revenue to increase, decrease, or remain stable in a given time period.

Methodology
Auto Insights Identifies the Top Factors to Explain Changes
In order to identify which segments within the dataset can be used to explain changes, Auto Insights uses EnsembleLearning , which combines several Machine Learning techniques into one analytical model in order to decrease variance (bagging), bias (boosting), and improve outcomes (stacking).
Examples of machine learning algorithms that are used:
Random Forest
Named Entity Recognition (NER)
Cramér's V
Other algorithms are used to take into account the context of the changes in question, in order to remove results that are not sensible.
注記
What Caused This will exclude segments with 2,000 or more levels from the selection criteria.
Users Declare Top Factors to Explain Changes
Users can enrich and tailor the results based on their business needs by setting segment relevancy. There are a couple of ways to edit relevancy...
Option 1: If you're a dataset owner, go to Datasets and select the 3-dot menu next to the dataset you want to edit. Then select Configure dataset > Configuration. Iterate through each measure to customize the Relevant Segments/Breakdowns that should be enabled.
Columns that are disabled from Relevant Segments/Breakdowns will not be available for use as a dimension for comparing metrics, in addition to not being shown in the 'What Caused This?' analysis for that measure

Option 2: Select Edit, then select Customize results on a Mission summary page or the settings icon on a Mission page. If you're the owner of the dataset, the Customize segment relevancy window displays for you to customize. If you're not the owner of the dataset, Auto Insights shows you the owners' email addresses. Ask an owner for access to customize the relevant segments and breakdowns for this measure.
注記
This functionality isn't available for sample datasets.
Identify Top Levels within These Factors to Explain Changes
Auto Insights looks at the variance and contribution of each level within a segment to determine which levels to call out.