Create Insights
创建预设报告
您可以手动创建预设报告或使用模板。
要创建预设报告,请从 Auto Insights 主页中选择 新建,然后选择预设报告。
从以下模板选项中选择 1 个:关键指标概览、KPI 深度分析报告、关联分析报告或创建空白画布。
KPI 深度分析:确认或选择您的数据集,然后选择度量值。然后,选择创建预设报告。Auto Insights 使用日期和时间戳为新的预设报告命名。您可以在“预设报告摘要”页面上更改它。
关键指标概览:确认或选择您的数据集,然后选择创建预设报告。Auto Insights 使用日期和时间戳为新的预设报告命名。您可以在“预设报告摘要”页面上更改它。
关联分析:确认或选择您的数据集,然后选择您的 2 个度量值。然后,选择创建预设报告。Auto Insights 使用日期和时间戳为新的预设报告命名。您可以在“预设报告摘要”页面上更改它。
注意
如果您使用的数据集没有时间序列数据,则关联分析不起作用。
选择创建空白画布以从头开始构建 — 通过从可用列中选择适当的计算类型(总和、平均值或计数)来配置 1 个或多个度量,以构建您的预设报告,或使用“平均值依据”下拉菜单选择复杂平均值。然后选择创建预设报告。
选择创建预设报告后,您将进入“预设报告摘要”页面,在此可查看您的所有洞察!在 Edit Preset Reports 页面上了解有关编辑预设报告的更多信息。请注意,如果您使用的数据集没有时间序列数据,则更改分析不可用。
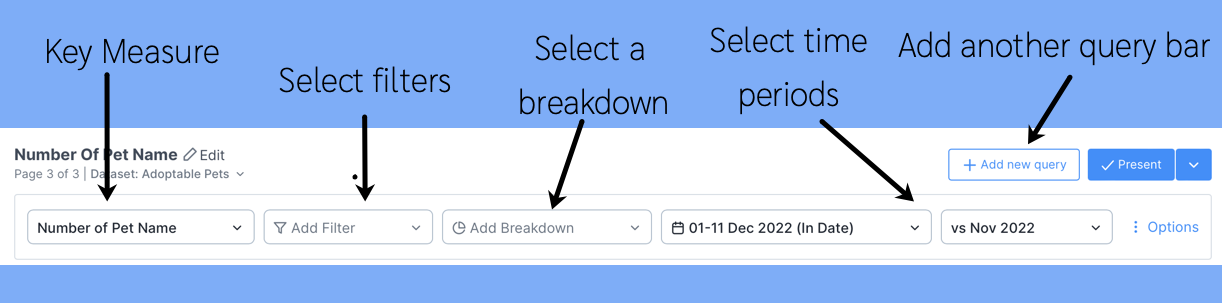
Query Bar
Each page has a query bar that provides the focus of analysis for that specific page. Use this query bar to get Auto Insights to search for insights on a specific area. Note: Time period selection is unavailable if you use a dataset without time series data.
Some questions to ask while interacting with the query bar:
Do I want Auto Insights to tell me where to focus?
I'm not sure which segment I should break down by. Things always change each month.
If this is what you need each month, let Auto Insights do the work and identify the largest contributing factors that cause the change.
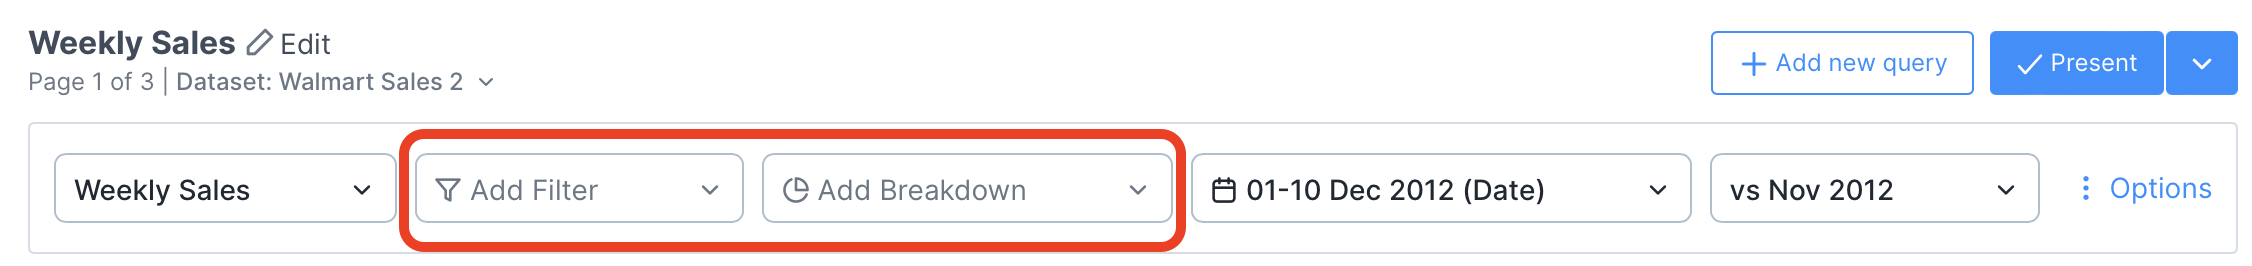
You should leave the filters and breakdowns blank in this scenario. This way, Auto Insights will calculate the largest contributing factors and display them in descending order.
OR
I know that I need to focus on a specific area...
I need to only look at my team's performance. I'm not interested in other teams.
I need to focus only on my product. I'm not interested in other products.
In this scenario, you should add filters to your query—for example, Team 6.
OR
I know that I want to compare across a segment (dimension)
I need to understand movement across all teams.
I need to know how my product is performing against other products.
In this scenario, you should add breakdowns to your query, for example, Teams.
