A guide to implementing Alteryx Auto Insights for a sales use case, including data structure and sample questions.
Problem Statement
Understanding sales performance is often focused on the ability to uncover areas where sales have increased or dropped significantly, which teams are hitting their goals, which manager has a large group of members with good or poor performance, who require additional coaching, and where new opportunities are (for example, significant growth).
Understanding these aspects is typically part of a daily standup, weekly huddle, or fortnightly and month-end reporting.
Who Are the Typical Creators and Viewers of This Use Case?
Creators: Data Analysts, Business Analysts
Viewers: Sales Managers, Store Managers, Team Leaders, Channel Partners, Relationship Managers, Marketing Managers, Chief Sales Officers, Chief Marketing Officers
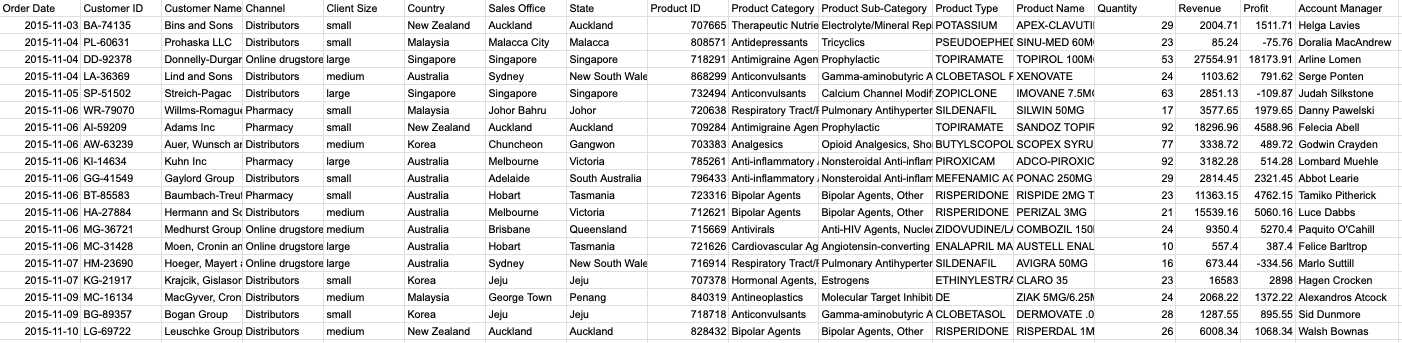
An Example of Sales Performance Data Structure
Right-click and 'open image in new tab' to expand the view.
Segments
A segment is a qualitative value, like names or categories. Here are some of the typical segments we find in sales performance data used in Alteryx Auto Insights:
Customer attributes: Customer name, Customer size, etc.
Product characteristics: Product category, Product sub-category, Product type, Product name, etc.
Team attributes: Team Name, Region, Channels, Sales Office Location, Account Manager, etc.
Measures
A measure is a quantitative, numeric value. Here are some of the typical measures we find in sales performance data used in Alteryx Auto Insights:
Sales Metrics: Revenue, Profit, Margins,
Team Metrics: Targets*, Variance to Target*
Other Metrics: Number of Customers (Client base), New Acquisitions, etc.
*You must upload a goals dataset to compare expenses to the budget and calculate variance over/under budget. Go to the Actuals vs Goals article to read more on the Alteryx Auto Insights goals feature.
What Sort of Insights Can Auto Insights Help Me Uncover?
Understand Sales Patterns
Product Category that is driving the increase this month
Understand revenue movement across the Channels.
Monthly/Quarterly/Yearly revenue compared to the previous comparable period
Best performing product type in the Financial Year
Decline in Top Customers' revenue this Quarter
Optimize Team Performance
Revenue variance to target by teams/regions/sales offices
Worst-performing sales offices for Q1 FY21
Which team/account manager missed targets for 2 months consecutively
Uncover New Opportunities
Growth by channel last Quarter
Best performing product category month on month
Revenue by channels, products, and regions