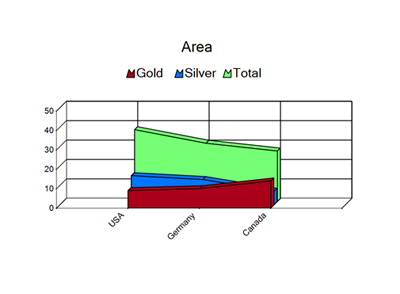
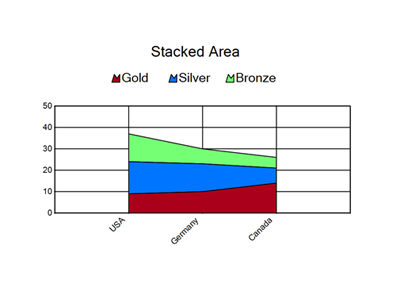
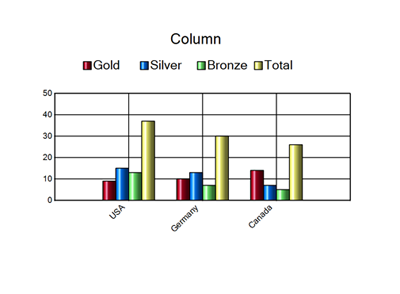
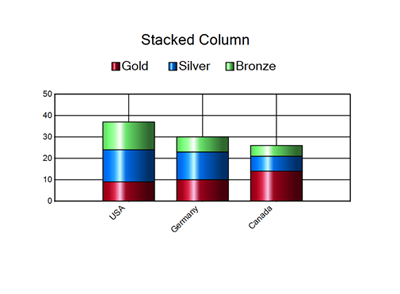
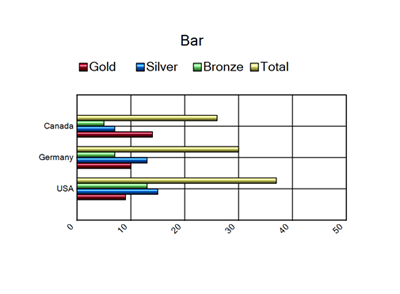
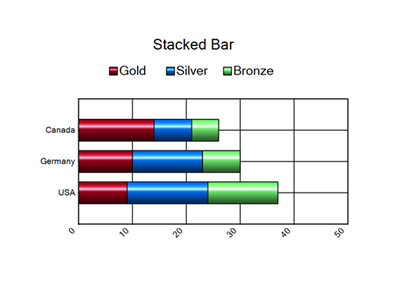
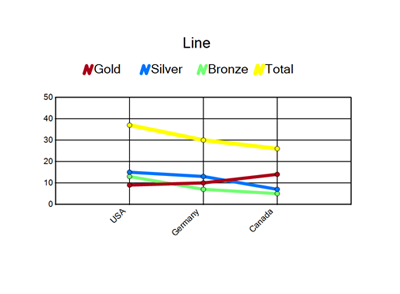
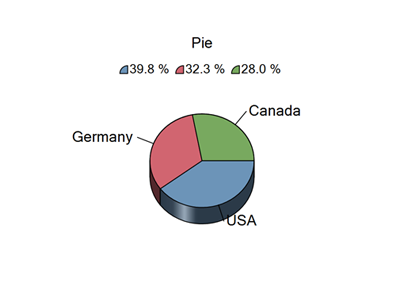
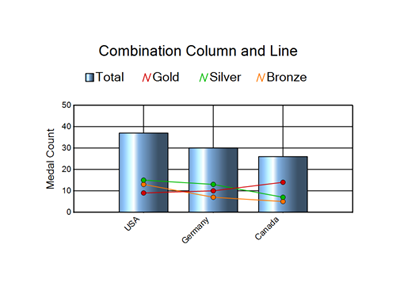
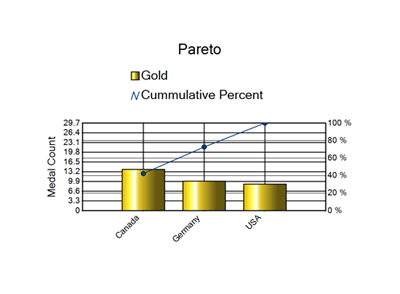
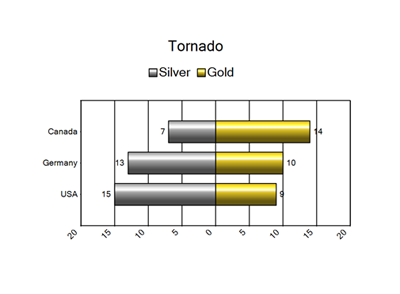
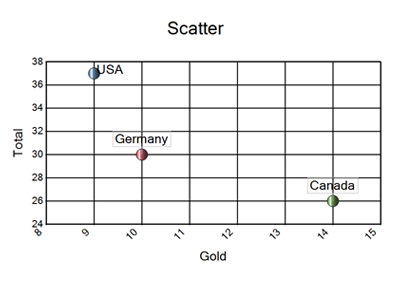
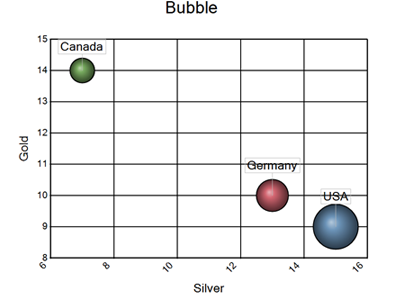
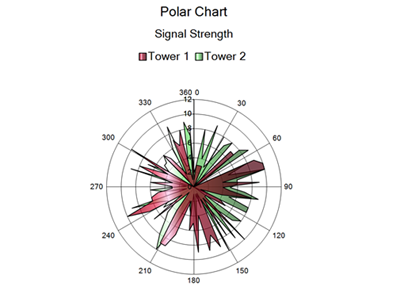
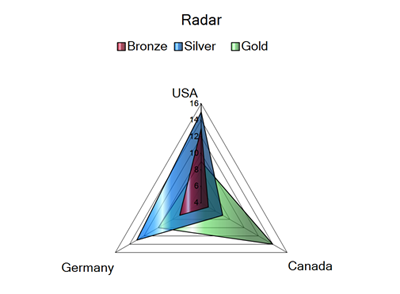
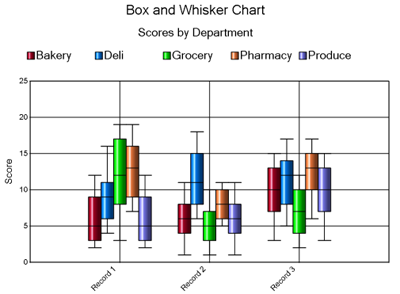
2024.1DesignerFerramentasGeração de RelatóriosFerramenta Geração de GráficosTipos de gráficoTipos de gráficoAs imagens a seguir mostram os tipos de gráficos que a ferramenta Geração de Gráficos pode configurar.ÁreaÁrea empilhadaColunaColuna empilhadaBarraBarras empilhadasLinhaPizzaCombinação de coluna e linhaCombinação de área e linhaParetoTornadoDispersãoBolhaGráfico polarRadarGráfico de caixa e whisker