Profile Results
When you run a job, you can optionally choose to generate a visual profile of the results of the job. A visual profile provides visual and statistical summary information on each column in your output dataset.
A visual profile provides visualizations on your dataset that you can use to refine your recipes or analyze the outputs of them. Since Designer Cloud can manage large volumes of data, visual profiling assists in analysis by summarizing column data in useful metrics, as determined by data type. For example, columns of Zip Code data type can be represented on a geographical map of the United States.
Note
Generating a visual profile can take more time and system resources to complete.
For more information, see Overview of Visual Profiling.
Generate Visual Profile
When you are specifying your job in the Run Job page, select the Profile results checkbox. Then, run the job. See Run Jobs.
Access Visual Profile
After the job has completed, you can review the visual profile in the Profiles tab of the Job Details page.
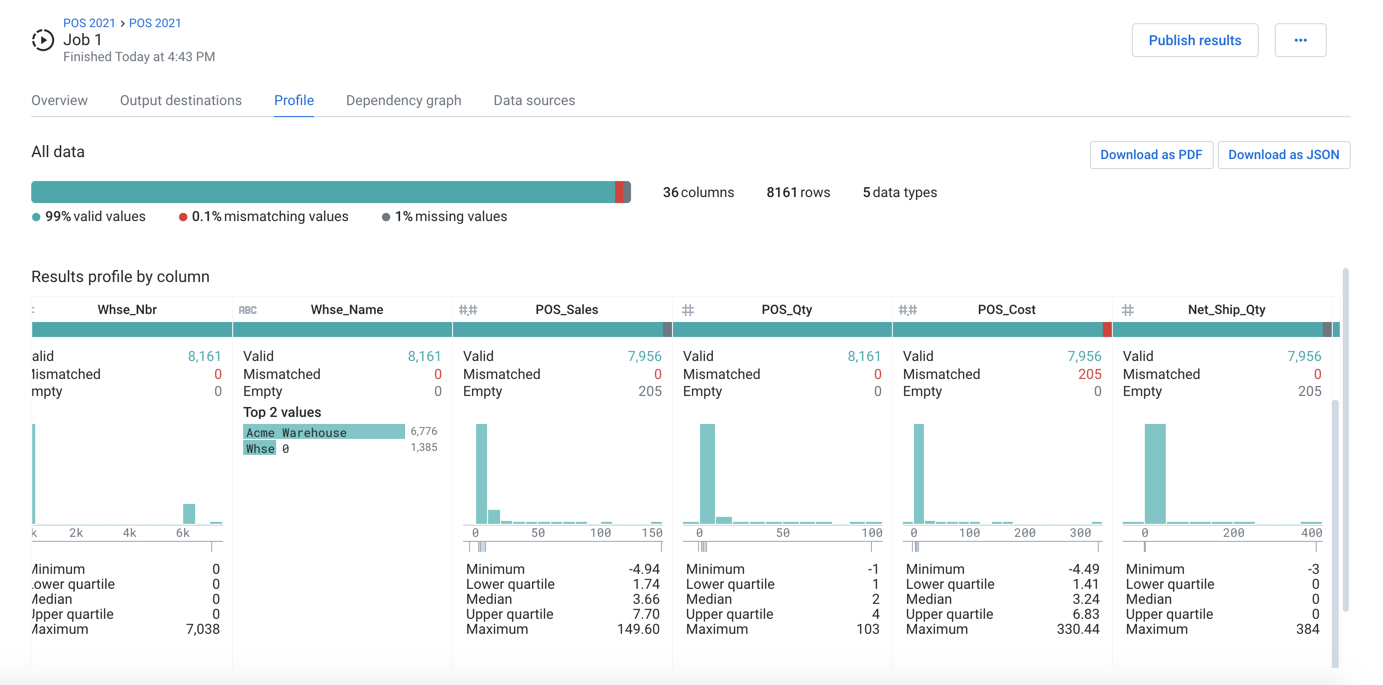
Figure: Example visual profile in Job Details page
In the above example, you can see summary statistics for the entire result dataset and breakdowns for individual columns based on data type:
Columns containing numeric data types include common statistical metrics including a histogram indicating frequency of values.
Since any value can be a String value, these columns illustrate only a histogram of values in the column.
Valid (green), mismatched (red), and empty (black) values are noted in column histogram bars.
Download Visual Profile
Visual profiles can become analytical datasets for use in other systems. You can download your visual profile in PDF or JSON format from the Job Details page.
Tip
JSON versions of the visual profile can be loaded into other systems for downstream uses.
Review Profiles in Columns
You can also review visual profiles of individual columns in development in the Transformer page and Column Details.
Tip
Visual profiles of column data in the Transformer page and Column Details page are interactive. When you select bars in the column histogram or data quality bar, suggestions for transformations are displayed, enabling you to rapidly transform your data of interest.
For more information, see Data Grid Panel.
For more information, see Column Statistics Reference.