Transform Basics
When you edit your dataset's recipe, the Transformer page is opened, where you begin your wrangling tasks on a sample of the dataset. Through this interface, you build your transformation recipe and see the results in real-time as applied to the sample. When you are satisfied with what you see, you can execute a job against the entire dataset.
Goal
Your data transformation is complete when you have done the following:
Cleansed your data of invalid, missing, or inaccurate values
Enhanced your dataset as needed with data from other datasets
Modified your dataset to constrain its values to meet the target schema
Executed job against the entire dataset
Exported the results from your dataset and recipe for use in downstream systems
Tip
Before you begin transforming, you should know the target schema that your transformed data must match. A schema is the set of columns and their data types, which define the constraints of your dataset. You can import this target schema as a dataset and use it during recipe development to serve as a mapping for your transformations.
A Quick Tour
The Transformer page experience is based on the design principles of predictive transformation. Predictive transformation allows you as the user to explore your data and guides you to possible next steps based on your explorations. Predictive transformation works in the following phases:
Visualize: Display your sampled data in tabular format with visualizations to indicate areas of interest, such as missing or invalid data or outlier values.
Interact: You can directly interact with the data to select things of interest to you. For example, you can click a black bar in a column visualization to select all of the missing values in the column.
Predict: Based on your selection(s), the predictive transformation model offers a set of suggested transformations. You can select one from the list. A suggestion may have multiple variations for further refinement. If you want to take it a step further, you can edit the suggested transformation directly to fine-tune the step.
Present: Each time you make a selection in the data grid or among the suggestion cards, the effects of the selected transformation are previewed in the data grid.
If all looks good, you add the transformation. The change is added to your recipe, which is the sequence of steps to transform your data.
Then, you repeat the above steps for the next data of interest. You can see this process in action below.
1 - Visualize
Below, you can see the Transformer page displaying a sample from the USDA-recognized Farmer's Markets in the United States as of the year 2014.
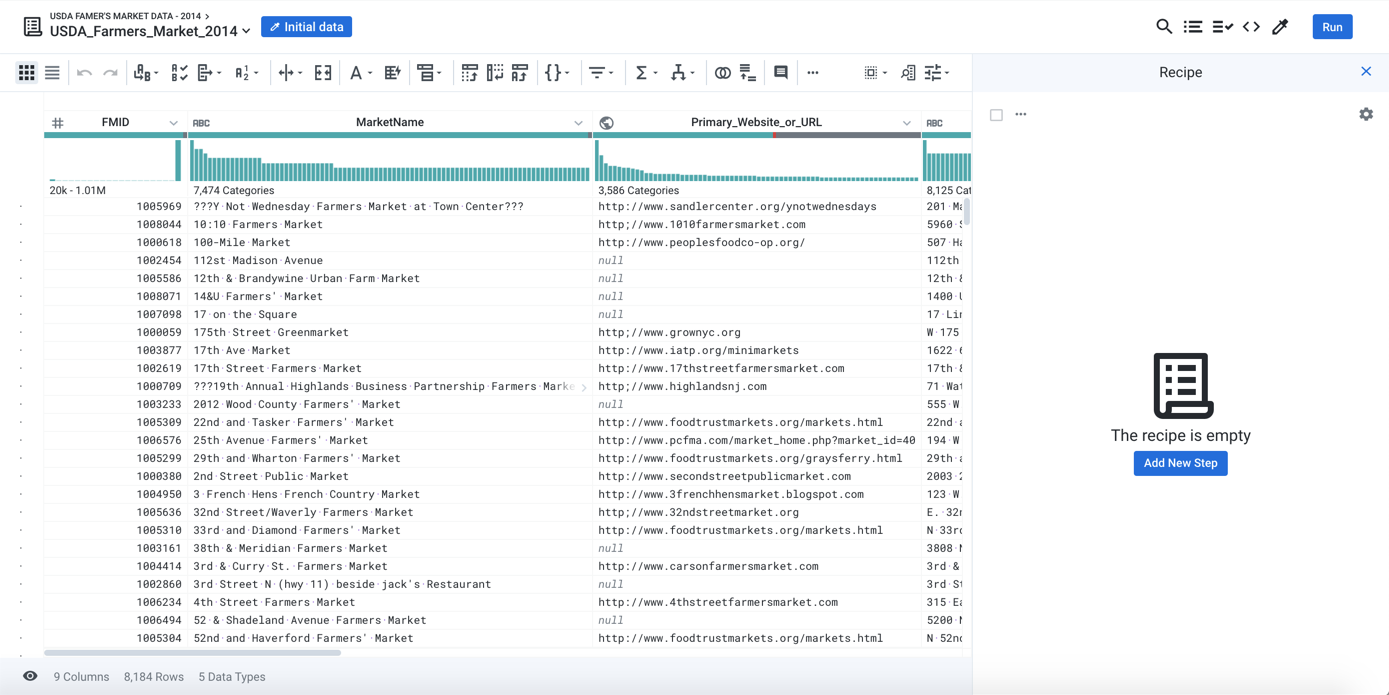
Figure: Visualize: Farmer's Market Data
The source of this data is an Avro file, which in its raw form does not look like this nice tabular representation. When a dataset is loaded into the Transformer page, the Cloud Portal attempts to represent it in tabular form, so that it is easy to navigate and analyze.
A few key things to notice:
Initial Data: This button indicates the current sample. Unless your dataset is small, the Transformer page displays in its data grid a sample taken from the first set of rows in the first file in your dataset. Be sure to read the section on Sampling below.
The Initial Data button is part of the menu bar, which provide access to key application features and capabilities. The menu bar is described later.
Below the menu bar is the toolbar, which contains a set of tools that you can select to apply to your data. The toolbar is described later.
The recipe is empty: This area is the recipe panel, where you can see the steps that you have added to your recipe. A recipe is the set of steps that you create to transform your data.
Primary_Website_or_URL: Above the data in each column you can see two bars.
Histogram: The lower bar is a histogram of values in the column.
Data quality bar: Above the histogram is the data quality bar, which displays the comparative percentage of valid (green), invalid (red), and missing (black) values in a column, as compared to the data type of the column.
2 - Interact
The data grid is not just for display; you can interact with it to select data elements of interest to you. For example, in the Farmer's Market dataset, you may have noticed that the Primary_Website_or_URL column has a large black bar, which indicates many missing values in the column. A reasonable interpretation of these missing values is that these Farmer's Markets do not have a known web site. To explore these markets, you click the black bar:
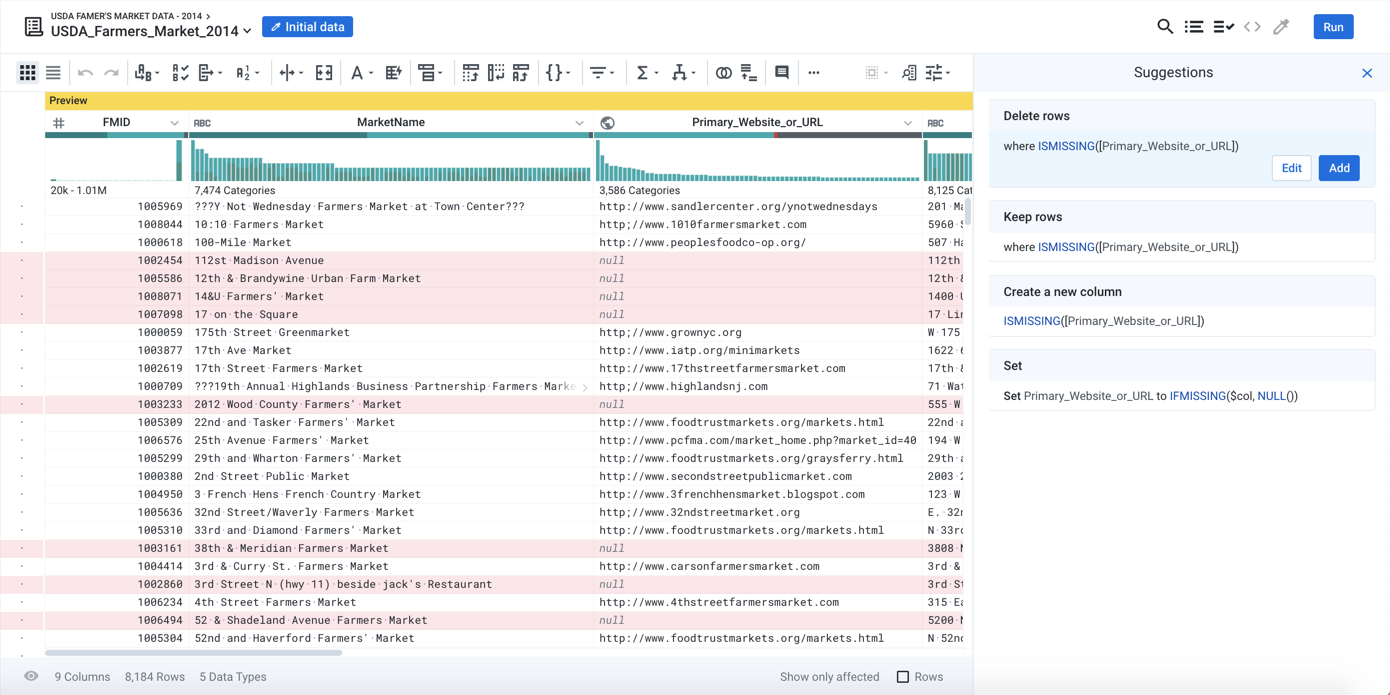
Figure: Interact: select missing values in a column
A couple of things to notice:
The right panel now displays a list of suggestions. These suggestions correspond to transformations that you can apply to the current selection. In this case, the selected data are the missing values in the
Primary_Website_or_URLcolumn.The first suggestion is selected by default. In the data grid, you can see a preview of what would happen if this step was added to the recipe. The highlighted rows would be removed.
Things you can select:
Column(s): Click a column header. Use
SHIFTorCTRL/COMMANDto select multiple columns.Row(s): To select a row, click the dot on the left side of the data grid.
Cell values: Click and drag to select part of a cell value. Double-click to select the whole cell value.
Histogram values:You can select one or more values in the histogram. Based on your selection(s), a set of suggested changes is presented to you. These changes apply to the rows where the selected values occur.
Data quality bar: You can select bars in the data quality bar.
3 - Predict
In the above example, predictive transformation predicted that based on your selection, you wanted to delete the rows where the website URL column was empty. This prediction is based on multiple factors, including:
Platform algorithms that interpret the meaning of user selections
Tracking of previous user interactions with your project or workspace of a similar nature.
So, the prediction makes sense; in most cases, if data is missing, you don't want the rest of the incomplete data in the row. However, suppose your interest in the data is different. Suppose that you are a website builder. You want to find the farmer's markets that don't have a website as potential customers. In this case, the second suggested transformation makes more sense: Keep these rows with missing values:
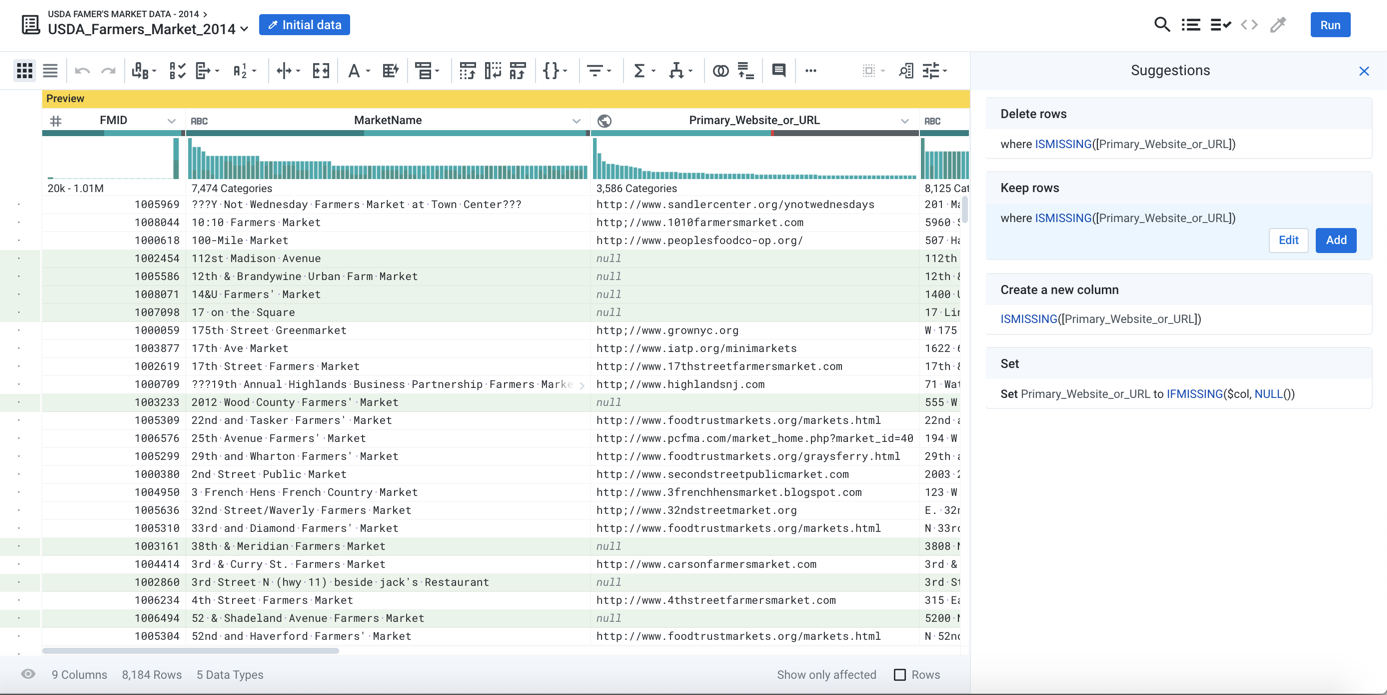
Figure: Predict: Multiple suggestions serve as guides to possible useful transformations
When the second suggestion is selected, the affected rows are highlighted in green, indicating that they will be retained.
Tip
To visualize assist in reviewing these rows, click the Show only affected checkbox at the bottom of the screen. Only the rows are displayed where the suggested transformation is to be applied.
4 - Present
If the selected suggestion looks good, click Add:
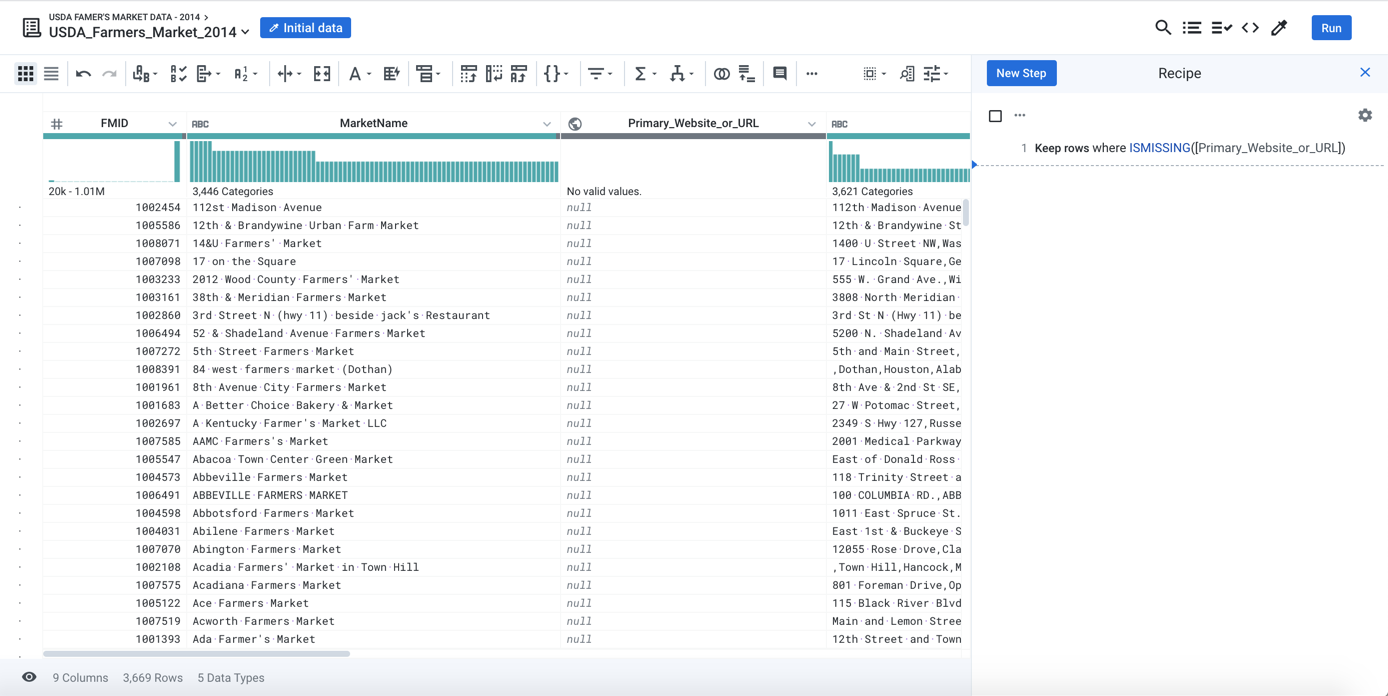
Figure: Present: Data grid is updated based on the transformation that has been applied
The transformation has been added to your recipe. Note at there is now a step in the recipe panel at right, which was previously empty. You've added a recipe step, and your sampled data is transformed.
The Cycle
The above represents the basic cycle of using the Transformer page:
Display & Interact: Locate data of interest and select it.
Predict: Review the suggested transformations.
Click them to preview the results.
You can also click Edit to make modifications to the suggested transformation before you add it.
Present: Add the selected and modified suggestion to your recipe. The sample of data in the data grid is transformed.
Repeat the above steps.
Recommended Methods for Building Recipes
Designer Cloud supports the following methods for building recipes in the Transformer page. These methods are listed in order of ease of use:
Select something. When you select elements of data in the Transformer page, you are prompted with a set of suggestions for steps that you can take on the selection or patterns matching the selection. You can select columns or one or more values within columns.
Tip
The easiest method for building recipes is to select items in the application. Over time, the application learns from your selections and prompts you with suggestions based on your previous use.
Toolbar and column menus: In the Transformer page, you can access pre-configured transformations through the Transformer toolbar or through the column context menus.
Tip
Use the toolbar for global transformations across your dataset and the column menu for transformations on one or more selected columns.
When a Transformer toolbar item is selected, the Transform Builder is pre-populated with settings and values to get you started. As needed you can modify the step to meet your needs.
The column menus contain the most common transformations for individual or multiple columns. Often, no additional configuration is required.
Select multiple columns. Continue selecting columns to be prompted with a different set of suggestions applicable to all of them.
Search and browse for transformations. Using the Search panel and the Transform Builder, you can rapidly assemble recipe steps through a simple, menu-driven interface. When you choose to add a step, you search for your preferred transformation in the Search panel. When one is selected, the Transform Builder is pre-populated from your selection in the Search panel.
Tip
Use the Transform Builder for performing modifications to the transformation you selected from the Search panel or a suggestion card.
Sample
Loading very large datasets in Designer Cloud can overload your browser or otherwise impact performance, so the application is designed to work on a sample of data. After you have finished your recipe working on a sample, you execute the recipe across the entire dataset.
The default sample is the first set of rows of source data in the dataset, the number of which is determined by the platform. For smaller datasets, the entire dataset can be used as your sample. In the Transformer page, it's listed as Initial Data in the upper-left corner.
In some cases, the default sample might be inadequate or of the wrong type. To generate a new sample, click the name of the sample in the upper-left corner.
Note
Collecting new samples requires system resources and storage. In some environments, collecting samples incurs monetary cost.
Tip
You should consider collecting a new sample if you have included a step to change the number of rows in your dataset or have otherwise permanently modified data (keep, delete, lookup, join, or pivot operations). If you subsequently remove the step that made the modification, the generated sample is no longer valid and is removed. This process limits unnecessary growth in data samples.
On the right side of the Transformer page, you can launch a new sampling job on your dataset from the Samples panel. You may have to open it first.
Cleanse
Data cleansing tasks address issues in data quality, which can be broadly categorized as follows:
Consistency. Values that describe the same thing should agree with each other. For example, numeric values should have the same precision. String values should be consistently structured to mean the same thing.
Validity. Values should be constrained to the requirements of each field's data type. For example, a DateOfSale field should be a valid date.
Reliability. Values in the same field in different records should mean the same thing. For example, the value
15in the Temperature field of two different records should not mean Centigrade in one record and Fahrenheit in the other record.
When data is initially imported, it can contain multiple columns, rows, or specific values that you don't need for your final output. Specifically, this phase can involve the following basic activities:
Remove unused columns
Address missing and mismatched data
Change data types
Improve consistency, validity, and reliability of the data
Note
An imported dataset requires about 15 rows to properly infer column data types and the row, if any, to use for column headers.
Use a row to create headers:
In most cases, the names of your columns are inferred from the first row of the data in the dataset. If you need to specify a different row, please complete the following:
Click the Search icon in the menu bar.
In the Search panel textbox, type:
headerThe transformation is displayed in the Transform Builder. Specify the following properties:
Transformation Name
Rename columnsParameter: Option
Use row as header
Parameter: Row
1
If you need to specify a different row to use, you can specify a specific row number to use in the Row textbox.
To add this or any transform in development to your recipe, click Add. This button is disabled if the step is invalid.
Generate metadata:
On the left side of the data grid, you might notice a set of black dots. If you hover over one of these, the original row number from the source data is listed. Since the data transformation process can change the number of rows or their order, you might want to retain the original order of the rows.
Tip
Some operations, such as unions and joins, can invalidate source row number information. To capture this data into your dataset, it's best to add this transformation early in your recipe.
To retain the original row numbers in a column called, rowId, please complete the following:
Transformation Name |
|
|---|---|
Parameter: Formula type | Single row formula |
Parameter: Formula | $sourcerownumber |
Parameter: New column name | rowId |
You can use a similar transformation to generate the full path and filename to file-based sources:
Transformation Name |
|
|---|---|
Parameter: Formula type | Single row formula |
Parameter: Formula | $filepath |
Parameter: New column name | filepath |
Delete unused columns:
Your data might contain columns that are not of use to you, so it's in your interest to remove them to simplify the dataset. To delete a column, click the caret next to the column's title and select Delete.
Tip
If you are unsure of whether to delete the column, you can use the same caret menu to hide the column for now. Hidden columns do appear in the output.
Tip
You can also delete multiple columns, including ranges of columns.
Check column data types:
When a dataset is imported, Designer Cloud attempts to identify the data type of the column from the first set of rows in the column. At times, however, type inference can be incorrect.
Tip
Before you start performing transformations on your data based on mismatched values, you should check the data type for these columns to ensure that they are correct.
Display only columns of interest:
You can choose which columns you want to display in the data grid, which can be useful to narrow your focus to problematic areas.
In the Status bar at the bottom of the screen, click the Eye icon.
Review data quality:
After you have removed unused data, you can examine the quality of data within each column just below the column title.
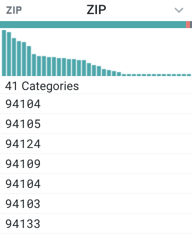 |
Figure: Column header with data quality bar
The horizontal bar, known, as the data quality bar, identifies the quality of the data in the column by the following colors:
Color | Description |
|---|---|
green | These values are valid for the column data type. |
red | These values do not match those of the column type. |
gray | There are no values for the column in these rows. |
Tip
When you select values in the data quality bar, those values are highlighted in the sample rows, and suggestions are displayed at the bottom of the screen in the suggestion cards to address the selected rows.
Example - Suggestion Cards
Based on your selections and its knowledge of common data patterns, Designer Cloud prompts you with suggested transformations. You can then select pre-configured transformations in the right panel of the Transformer page to quickly add steps.
Tip
Where possible, you should try to create your transforms by selecting data and then selecting the appropriate suggestion card. In some cases, you might need to modify the details of the recipe.
In the following example, the missing values in the SUBSCRIBER_AGE column have been selected, and a set of suggestion cards is displayed.
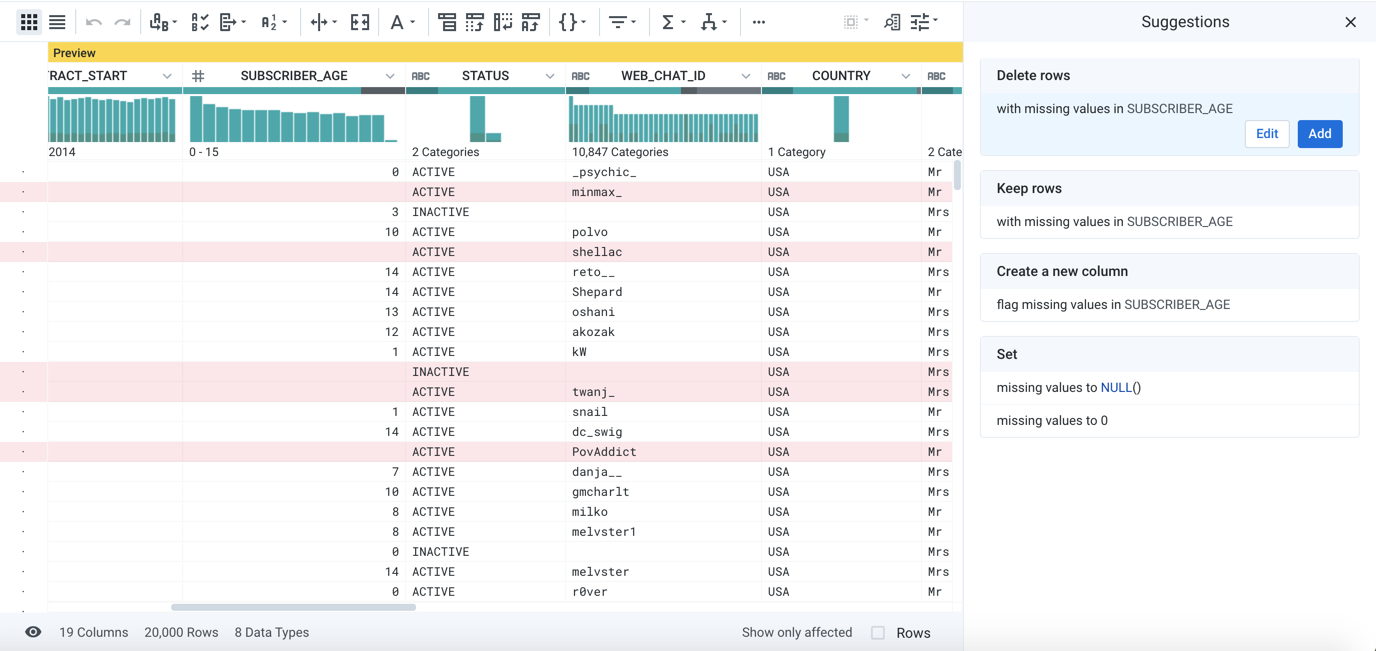
Figure: Selecting missing values
Tip
When previewing a recipe step, you can use the checkboxes in the status bar to display only affected rows, columns, or both, which helps you to assess the effects of your step.
Depending on the nature of the data, you might want to keep, delete, or modify the values. Since the data is missing, the Delete card has been selected.
To accept this suggest, click Add.
You can modify the step if needed. An example is provided later.
For more background information, see Overview of Predictive Transformation.
Change data types:
If a column contains a high concentration of mismatched data (red), the column might have been identified as the wrong data type. For example, your dataset includes internal identifiers that are primarily numeric data (e.g. 10000022) but have occasional alphabetical characters in some values (e.g. 1000002A). The column for this data might be typed for integer values, when it should be treated as string values.
Tip
Designer Cloud maintains statistical information and enable some transformation steps based upon data type.
To change a column's data type, click the icon to the left of the column title.
Select the new data type.
Review the mismatched values for the column to verify that their count has dropped.
Explore column details:
As needed, you can explore details about the column's data, including statistical information such as outliers. From the caret drop-down next to a column name, select Column Details.
Review Histograms
You can review a histogram of the values found in the column. Just below a column's data quality bar, you can find the histogram of values. In the following example, the data histogram on the left applies to the ZIP column, and the right applies to the WEB_CHAT_ID column.
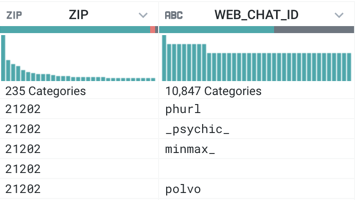 |
Figure: Column data histogram
When you mouse over the categories in the histogram, you can see the corresponding value, the count of instances in the sample's column, and the percentage of affected rows. In the left one, the bar with the greatest number of instances has been selected; the value 21202 occurs 506 times (21.28%) in the dataset. On the right, the darker shading indicates how rows with ZIP=21202 map to values in the WEB_CHAT_ID column.
Tip
Similar to the data quality bar, you can click values in a data histogram to highlight the affected rows and to trigger a set of suggestions. In this manner, you can use the same data quality tools to apply even more fine-grained changes to individual values in a column.
Assess Data Quality
You can create data quality rules to apply to the specifics of your dataset. For example, if your dataset includes square footage for commercial rental properties, you can create a data quality rule that tests the sqFt field for values that are less than 0. These values are flagged in red in a data quality bar for the rule for easy review and triage.
Tip
Data quality rules are not transformation steps. They can be used to assess the current state of the data and are helpful to reference as you build your transformation steps to clean up the data.
For more information, see Overview of Data Quality.
Enrichment
Before you deliver your data to the target system, you might need to enhance or augment the dataset with new columns or values from other datasets.
Union datasets:
You can append a dataset of identical structure to your currently loaded one to expand the data volume. For example, you can string together daily log data to build weeks of log information using the Union page.
Join datasets:
You can also join together two or more datasets based on a common set of values. For example, you are using raw sales data to build a sales commission dataset:
Your sales transaction dataset contains a column for the salesman's identifier, which indicates the employee who should receive the commission.
You might want to join your sales transaction dataset to the employee dataset, which provides information on the employee's name and commission rate by the internal identifier.
If there is no corresponding record in the employee dataset, a commission is not rewarded, and the sales transaction record should not be present in the commission dataset.
This commission dataset is created by performing an inner join between the sales transaction dataset and the employee dataset. In the Search panel, enter join to join data.
Lookup values:
In some cases, you might need to include or replace values in your dataset with other columns from another dataset. For example, transactional data can reference product and customer by internal identifiers. You can create lookups into your master data set to retrieve user-friendly versions of customer and product IDs.
Note
The reference data that you are using for lookups must be loaded as a dataset into Designer Cloud first.
To perform a lookup for a column of values, click the caret drop-down next to the column title and select Lookup....
Sampling
The data that you see in the Transformer page is a sample of your entire dataset.
If your dataset is small enough, the sample is the entire dataset.
For larger datasets, Designer Cloud auto-generates an initial data sample from the first rows of your dataset.
For larger datasets, you must learn how to generate new samples, which can provide different perspectives on your data and, in complex flows, enhance performance.
Tip
Sampling is an important concept in Designer Cloud.
Profile
As part of the transformation process, you can generate and review visual profiles of individual columns and your entire dataset. These interactive profiles can be very helpful in identifying anomalies, outliers, and other issues with your data.