Data Quality Rules Panel
Through the Data Quality Rules panel, you can quickly build rules to test the specifics of your dataset.
Data quality rules allow you to apply tests that are specific to the nature of your data.
Example:
Suppose you have a column of Decimal values called, TotalVolume-m, which contains the total volume in cubic meters of an order. While negative values are valid for Decimal data type, they should not be appearing as values for volume. You could create data quality rules for the following:
TotalVolume > 0TotalVolume >= 100
The first data quality rule tests all rows in the TotalOrder column to see if they are greater than 0. Values that are equal to or less than zero are indicated in the red bar.
The second data quality rule may be specific to the meaning of your data. Suppose that you cannot ship in a single order any volume that is greater than 100 cubic meters. As the order is transformed through your cleansing operations, this rule flags any individual order that exceeds 100 cubic meters.
As you transform your data through recipe steps, you can review how the data tests against your defined set of data quality rules.
Tip
To permit Designer Cloud to suggest data quality rules to apply, click View suggestions. See below for details.
For more information on the data quality features of Designer Cloud, see Overview of Data Quality.
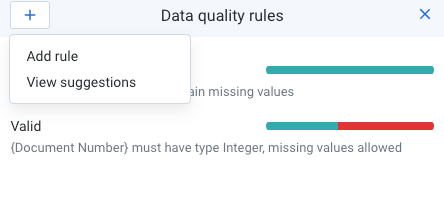 |
Figure: Data Quality Rules panel
In the panel, each data quality rule available for the recipe is listed. You can review the rule type and the specifics of the condition or conditions that it tested.
Note
Data quality rules are not transformation steps. They assess the current state of the sampled data in the Transformer page.
Note
As you apply transformation steps to the data, the state of your data quality rules is automatically updated to reflect the changes. If you delete columns or other elements referenced in the data quality rules, errors are generated in the Transformer page.
Add Rule
To begin, click Add rule.
Select a rule to create. For more information on the available rules, see Data Quality Rules Reference.
May be missing: Some rule types support the May be missing checkbox. When it is enabled, the Data Quality rule allows missing values to be acceptable for a specified column.
Note
The May be missing rule parameter is not applicable to Not Null, Not Missing, Not Equal, Not In Set and Formula.
In preview, the rows that pass the rule are highlighted in green, while the rows that fail the rule are in red.
To add the rule to your set, click Add.
For more information, see Add Data Quality Rule.
View and add suggestions
You can permit Designer Cloud to suggest data quality rules pertaining to your dataset.
Tip
These suggestions are based on heuristics applied to the sampled data. They can accelerate the process of developing rules and can improve their relevance to the aspects of the data that you wrangle.
In the Data Quality Rules panel, click View suggestions.
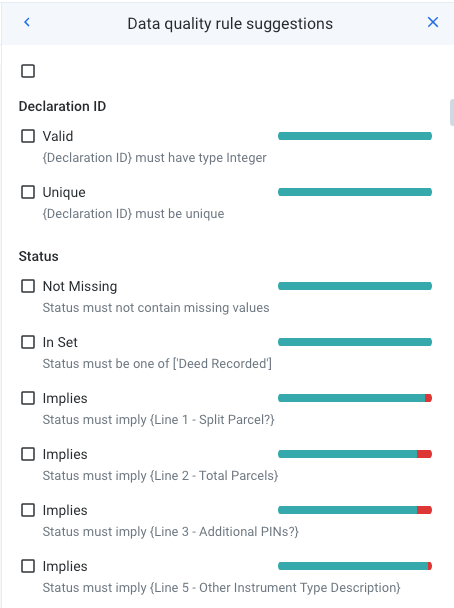 |
Figure: Data Quality Rules panel - View suggestions
Review the rules that are suggested for you:
Select rules of interest.
If you select multiple rules, you can use the icons at the top of the panel to add the rules or to discard the suggestions.
Single-rule options are available through the context menu for the suggestion. See below.
Context menu options:
Add to rules: Add the selected rule to the rules for your dataset.
Discard suggestion: Discard the rule from your list of suggestions. You can manually add it back later if needed.
Show failing values only: When selected, the values that fail the rule test are highlighted in the data grid.
Show passing values only: When selected, the values that pass the rule test are highlighted in the data grid.
Clear rule preview: Clears any highlighted values that are previewed in the data grid.
Use Rules
After adding the rule, you can use the quality bar to analyze and take action.
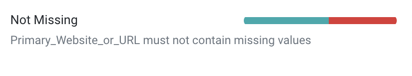 |
Figure: Rule quality bar
Rules evaluate to either pass or fail:
The green segment indicates the rows that pass the rule.
The red segment indicates the rows that fail the rule.
Tip
Hover over a segment in the data quality bar to see the number of rows and percentage of the sample that pass or fail the rule.
Click either bar to filter the table view to show the rows that pass or fail the rule.
Tip
As you add recipe steps, the quality bars in this panel are updated. You can use them as a continuing check to see how well the data is being cleaned.
Options
For each rule that you create, the following options are available:
Edit rule: Edit the data quality rule.
Delete rule: Delete the data quality rule.
Note
Deleting a data quality rule does not affect your data.
Show Failing Values Only: In preview, highlight in red only the values that failed the rule.
Show Passing Values Only: In preview, highlight in green only the values that passed the rule.
Clear Preview: Remove the value highlighting from the data grid.
Rules in Job Details
After you have successfully run your job, you can review the results of your data quality rules applied across the entire dataset in the Rules tab.
Note
To see the results of your rules in the Job Details page, profiling must be enabled for the job. See Run Job Page.
For more information, see Job Details Page.