Overview of Predictive Transformation
Based in academic research, Predictive Transformation refers to a set of design and interface principles that serve as the foundation for how Alteryx users interact with their data. Predictive transformation is the linchpin of the platform. This section provides an overview of the concepts and links to locations where these concepts are surfaced in the interface.
Predictive Transformation is a registered trademark.
Overview
In essence, Predictive Transformation seeks to bring closer together:
the domain knowledge about the data, and
the technical knowledge of the sometimes complex operations required to render data into its final usable format.
In data wrangling, the former knowledge set resides with domain experts who understand the meaning of the data, while the latter often requires involvement of IT, which may have no contextual understanding of the data to inform their solution designs.
This process of rendering data from one format into another is generally called data transformation, which breaks down into a set of programming-type tasks, with an emphasis on structure, meaning, and the statistical properties of the data. These tasks include:
statistical manipulation (profiling, outliers, imputation)
restructuring (data extraction, nesting, pivot/unpivot)
cleaning (standardization, deduplication, data removal)
enrichment (join with other data, lookups of reference data)
distillation (sampling, filtering, aggregation, windowing)
Across large, distributed datasets, these tasks can be technically challenging to properly execute. To move them out of the IT domain, Predictive Transformation seeks to deliver the following capabilities:
Features & Visualizations - innovative methods to display and select data of interest
Suggestions - based on user selection, suggested transforms are presented to you for selection and configuration
Previews - for the selected suggestion, previews of the anticipated change are available for review prior to inclusion in the transformations on the dataset
The above cycle is repeated over and over until the set of transformations is defined and executed to satisfaction.
Phases
Based on user selection, Predictive Transformation guides you toward possible next steps yet allows you to decide the step to take and (if necessary) refine the step definition. The core of the guide/decide loop of Predictive Transformation fits into the following iterative phases. When steps are selected, visualizations are updated, and the cycle repeats again.
Phase | UI Element | Description |
|---|---|---|
Visualize | visualizations | A critical component of Predictive Transformation is the visual representation of the data, including items of interest for selection. In larger data sets, the visual cues around items of interest and the tools for interacting with them provide information on the meaning of each type of interaction and are critical for a productive and pleasant user experience. |
Interact | selections | You interact directly with the visualizations to select values, columns, or other items of interest. |
Predict | predictive model & suggestions | Automatically, user selections trigger queries into the predictive model. Data, metadata, and the selection of it effectively define queries of the predictive model. The model returns a set of suggested transforms. The suggestions guide you toward recommended actions on items that you has decided, through selection, are interesting. You can then decide which suggestion to undertake, including modification of the specific parameters around the suggestion. Or, you can define a completely different step to take. |
Present | previews | Whenever the step to take is selected or subsequently modified, the anticipated results of that step are displayed as a preview overlay on top of the data. This method allows for easy development, rapid undoing, and a clearer understanding of the impacts of each step. |
Visualizations
In Predictive Transformation, visualizations must be carefully designed to surface selectable data or metadata of interest. In Dataprep by Trifacta, the Transformer page has been designed to represent the underlying dataset while guiding you with selectable items.
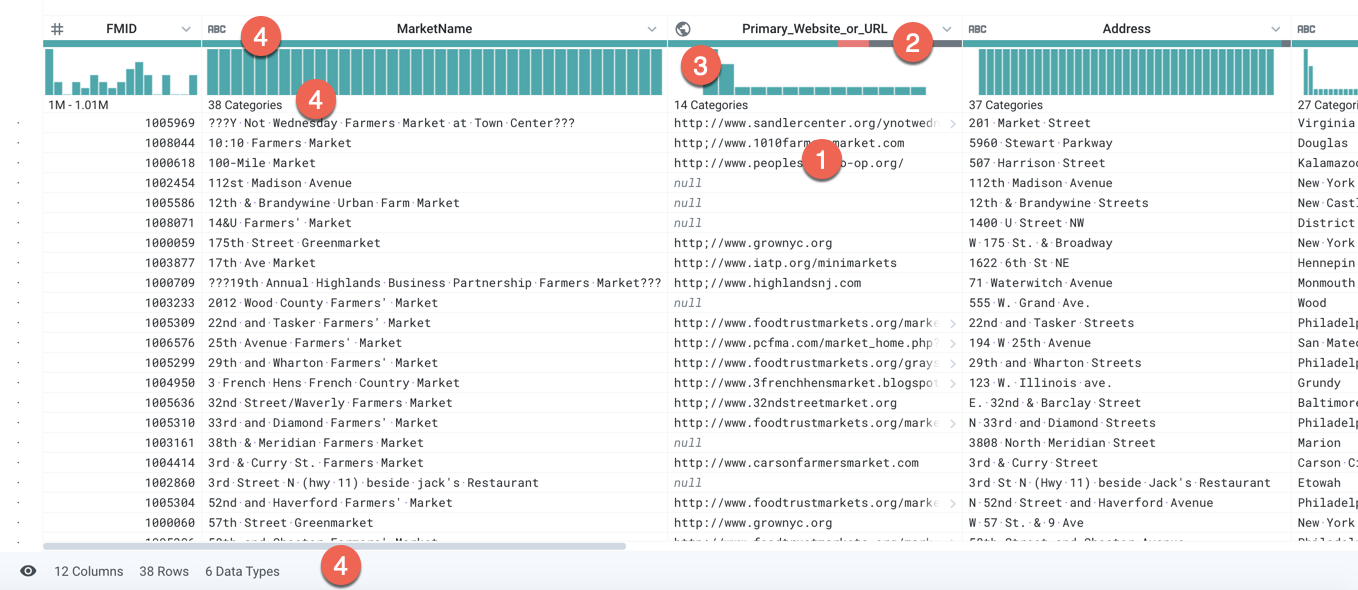
Figure: Transformer Page contains a rich overlay of information and selection cues
Specific visualization cues:
Data rendered into familiar grid format, regardless of underlying structure
selectable values and columns
Color-coded data quality bars:
green: valid
gray: missing
red: invalid (checked against data type)
Select a color to select all corresponding values
Histograms for individual columns:
Select one or more values in the histogram highlights corresponding values in other column histograms for easy visual comparisons
Metadata on entire dataset and type and statistical information for individual columns. See Column Details Panel.
In this manner, this visualization lifts user interaction from the domains of data and code into a more visual representation.
Tip
You must still specify via selection; the syntax of the specification is lifted into the visual domain, and the details of crafting the technical query are managed by the application.
Exploration: By design, this interaction model supports both detailed specificity and ambiguity. You selects preview the results, and then determine if the preview meets expectations. Additionally, all steps can be undone and removed from the recipe, so that you can explore different steps and entire approaches for transforming data. Solutions that demand more technical interactions often suffer from an intolerance of ambiguity, which limits your ability to express intent without significant experience and/or training. See Transformer Page.
Selections
As you review the visualization, a change in the cursor indicates the items that are available for selection.
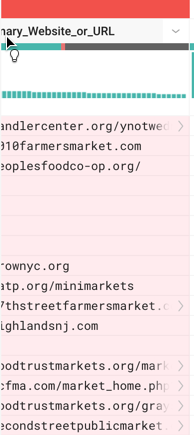
Figure: Selection cursor changes on hover of selectable items
The following types of selections trigger the subsequent phases:
cell values and values within a cell
columns
Tip
Selecting a single column in the data grid triggers a visual profile of the column data, as well as a set of suggestions. Selecting multiple columns triggers a different set of suggestions to apply across your selected columns.
values in a data histogram
categories of values (valid, invalid, missing) within a data quality bar
Columns and values can be multi-selected.
Tip
You are still obligated to make selections in the data, thereby bringing domain-specific expertise to the problem of transforming it. This selection in turn triggers a more complex query through the application to the prediction service.
Predictive Model
Based on the set of selections, an inference algorithm attempts to interpret the data transformation intent of the selection and generates a ranked set of suggestions and patterns for the selections to match. For example, if you select the first three characters in a cell, the algorithm may produce two transform suggestions for data removal: one to remove the rows containing the specific text and one to keep all rows containing that pattern of text in the column.
As part of the returned results of the predictive model, matching values for the selection(s) are highlighted in the table.
Tip
The predictive model interprets selection to identify intent. Possible intentions are surfaced as one or more suggested transforms in a visual manner that minimizes exposure to the transformation language.
Suggestions and Their Variants
The set of probable next steps is computed by the predictive model from user interaction, selected data, historical information, and other sources and rendered as a set of suggestions. Since these steps are essentially predictions of user intent, they are surfaced as browsable cards, through which you can explore to disambiguate the uncertainty of intention around their data selections.
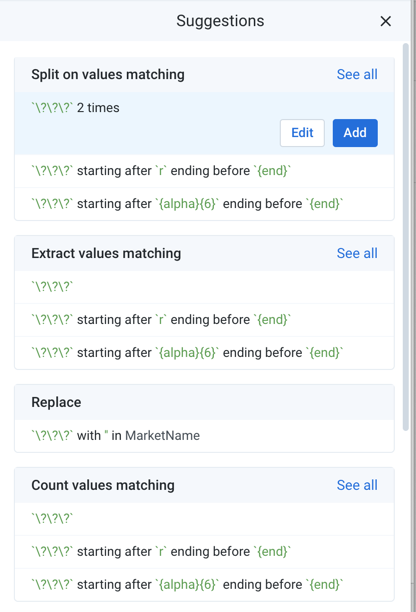
Figure: Suggestion cards - selection guides suggestion
Notes:
Typically, pattern-based variants to the suggestion are listed first in the suggestion card.
Pattern-based suggestions are always based on Wrangle , which are easier to use than regular expressions.
Variants using literal expressions are typically listed last. If a column has a high number of literal values, however, literal value variants may be listed first in the card.
Tip
Suggestion cards are specific enough for immediate execution. You can choose to modify the transform and its parameters, if additional specification and guidance is needed.
In a suggestion card, you may see multiple variants of the selected transformation.
The first variant is the most specific one applicable to the current selection in the data grid. Mouse over the variants to see different versions of the transform. As you mouse over secondary variants, the variants typically become more specific in their changes to the dataset or rarer in their usage.
Tip
When you mouse over a different transform variant in the suggestion card, the preview popup is automatically updated to reflect the variation. When you select the variant, the Preview pane is updated. You can always modify the transform to review the detailed differences.
Previews
When a suggestion card is selected, the results of the selected transform are previewed in the data grid, so that you can see in advance the changes to the dataset.
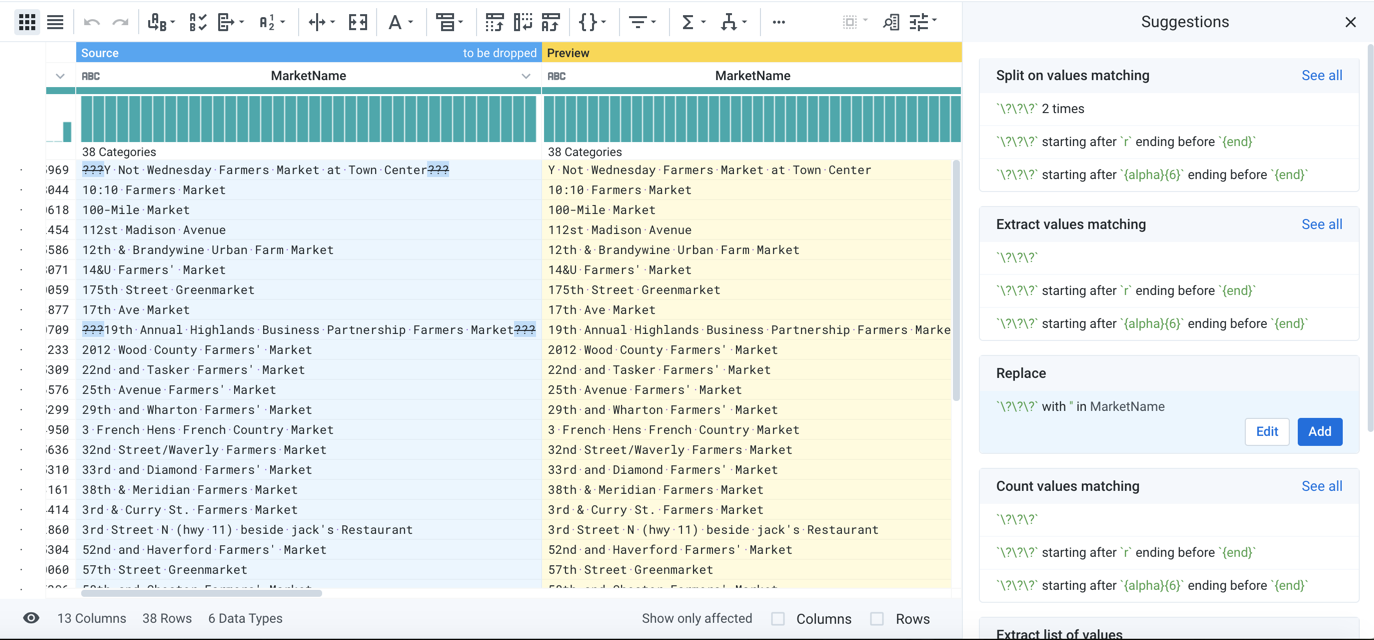
Figure: Previewed effects of transform
When the transform is added to the recipe, the transform is rendered into the data transformation language and applied in real-time to the dataset, so that you can immediately begin working on the next step of the process.
Tip
When a transform is selected, the selected transform and any additional guidance that you provide is translated into a specific, programmatic step in the transformation language. This step, in turn, is rendered into a complex and potentially distributed query that is applied across the dataset. In this manner, additional technical details and the knowledge required to master them are removed from user requirements.
Additional Steps - Modification
Modification via Transform Builder
As needed, any selection can be modified, such that you may tweak parameters to further refine intention to reach a specific outcome. In Dataprep by Trifacta, you can click Edit to tweak individual transformations in the Transform Builder.
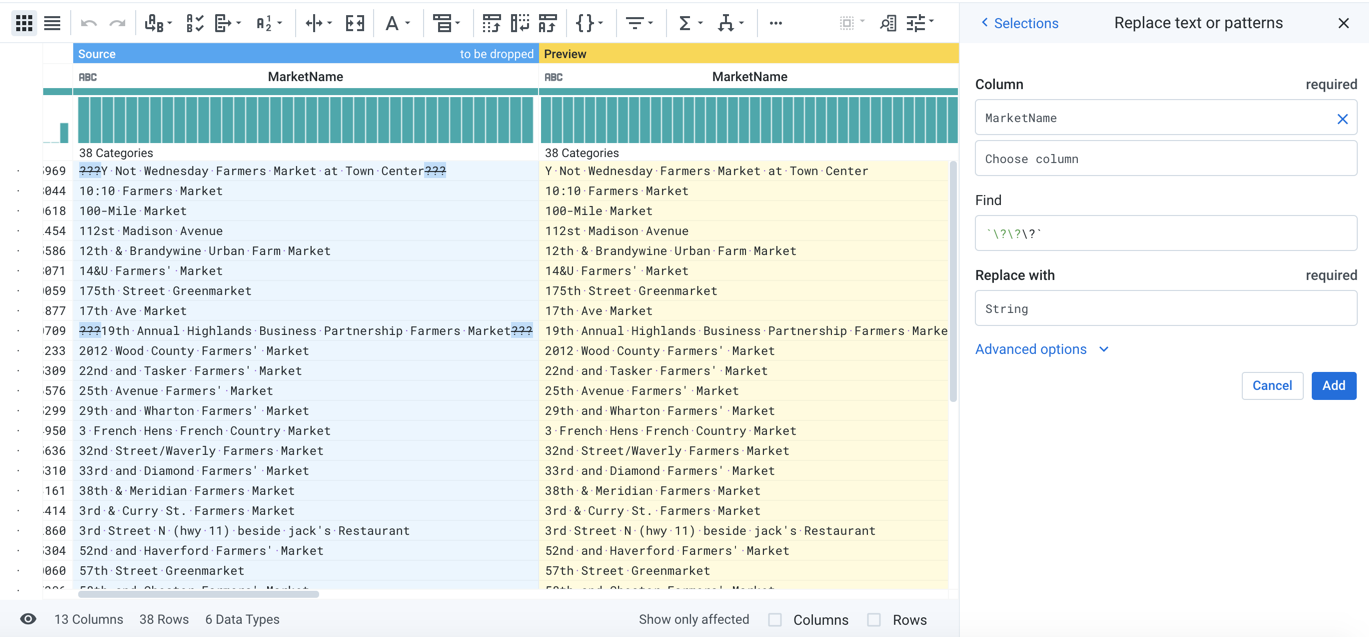
Figure: Modifying a transform in the Transform Builder
Wrangle
The actual steps of transformation are authored in Wrangle. Wrangle includes the following characteristics:
Single-source transformations, with results rendered without modification to the original source data
General cleaning and transformation operations on numerical and textual data of varying data types
Structural transformations for managing nested data like JSON
Multi-dataset transformations such as lookups, joins, and unions
Transformation of data to metadata, such as pivot and unpivot operations
Text selection patterns, including regular expressions, as a macro-type set of references. See Text Matching.
For a list of available transforms and functions, see Language Index.
For more information, see Wrangle Language.