Data Grid Panel
The data grid in the Transformer Page displays how your current recipe applies to the data in your currently selected sample.
The grid is the default view in the Transformer page of Dataprep by Trifacta.
To open the data grid, click the Grid View icon in the Transformer bar at the top of the page.
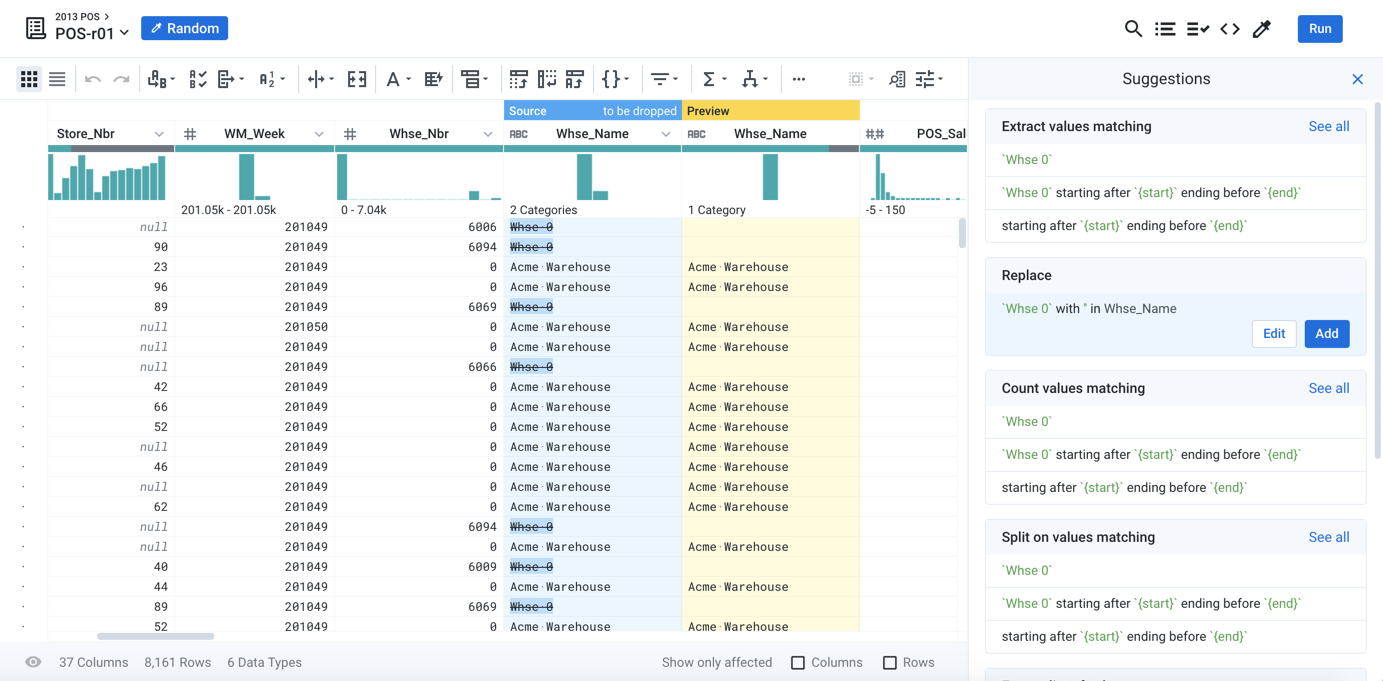
Figure: Data Grid Panel
Data not displayed: From Flow View you can choose to edit your recipe without loading a sample for faster editing. You can select a different sample with the data grid off. If needed, click Enable data grid to load the currently active sample.
Note
This feature can be enabled or disabled by an administrator.
For more information, see Dataprep Project Settings Page.
Select:
Click column headings to review a visual profile of the column's data and a set of suggestions for transformations to apply to the column.
These columns appear in the context panel on the right side of the screen.
Tip
Keep clicking columns. You can select multiple columns to prompt for another set of applicable suggestions.
Suggestions are also generated when you select one or more values in the data histogram for a column or individual values in the displayed rows of the sample.
Select specific values in a column for suggestions on those strings.
Note
Values in a cell cannot exceed 25,000 characters in length.
Tip
If you select a single value in the data grid, the suggestion cards suggest operations specific to that string. If you multi-select multiple values, the suggestions can apply any pattern shared between the values. For example, selecting "
, CA" and ", NY" results in suggestions for how to handle state abbreviations in a column.
Scroll:
Use the vertical scroll bar to the right of the displayed rows of data to show other rows in the sample. To review rows of the sample data that are not displayed, you may click values in a column and then scroll down through the sampled data.
Use horizontal scrolling to review additional columns that are off-screen.
Tip
If the contents of a cell are too large for the display, you can click the Caret ( > ) icon to the right of the cell value in the data grid to display the entire contents of the cell.
Add or Edit:
To add a selected suggestion card to your recipe, select the card. Then, click Add.
To modify a suggested recipe step, select its suggestion card and click Edit. See Transform Builder.
To review details about an individual column, select Column Details from the column drop-down. See Column Details Panel.
To review details about a selection of columns, click the Column View icon in the Transformer bar. See Column Browser Panel.
Ordering:
You can reorder the rows based on the values in a column. From the Column menu, select Sort A → Z. For more information, see Column Menus.
Note
Transforms that use the group parameter can result in non-deterministic re-ordering in the data grid. However, you should apply the group parameter, particularly on larger datasets, or your job may run out of memory and fail.
Transformer Toolbar
At the top of the data grid, you can use the toolbar to quickly build common transformations, filter the display, and other operations. See Transformer Toolbar.
Status Bar
Below the data grid, you can review summary information about the data in your currently selected sample. You can review the number of data types and rows and column information for the sample currently displayed in the data grid. These metrics are updated based on the recipe steps that you apply to the sample.
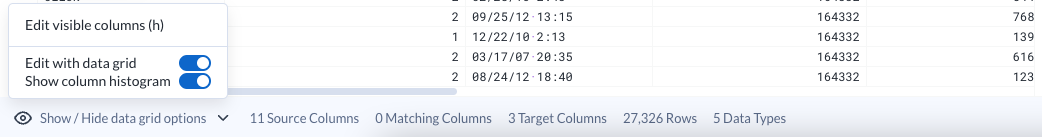
Figure: Sample Status bar
Show/Hide Data grid options: Click the drop-down to:
Edit visible columns: Show or hide the visible columns. For more information, see Visible Columns Panel.
Edit with data grid: You can toggle updating of the data grid based on the changes to your recipe. When disabled, the data grid is frozen. You can also enable the data grid by using the reload icon available.
Note
Some transformations cannot be added or modified when the data grid is disabled.
This feature can be enabled or disabled by an administrator. For more information, see Dataprep Project Settings Page.
Show column histogram: You can toggle to show or hide the histograms over each column in the data grid.
Note
Histograms cannot be toggled when the data grid is disabled.
The status bar contains metrics about the current dataset sample for the currently selected recipe step.
For example, if your first recipe step removes 100 rows of data, when you create your next recipe step, the status bar should indicate a row count that is 100 less than the row count at the start of the recipe. The other counts may be affected as well.
The number of columns reflects the count that is currently displayed in the data grid. Toggling visibility of columns or applying column-based filters changes this value.
Note
Counts of data types may reflect that varying formats of Datetime columns are considered different types for this computation.
Tip
Before you begin transforming your data, you might want to verify the columns and count of data types against the data before it was imported. If there are discrepancies, you might want to investigate the differences. Unless your sample includes the entire dataset, row counts should differ.
Note
In the Trifacta Photon running environment, results can differ between executions of the same recipe due to its parallel execution and data limiting within the Transformer page. In particular, joins with multiple matches per key can sometimes cause a difference in the number of reported rows when the job is re-executed.
Show only affected:
When transformation steps are previewed, you can use these checkboxes to display only the previewed changes for affected rows, columns, or both.
Tip
These options assist in narrowing the data grid display to only the steps affected by the current recipe step.
Find Column
In a wide dataset, click the Find icon in the Transformer toolbar to locate the column of interest.
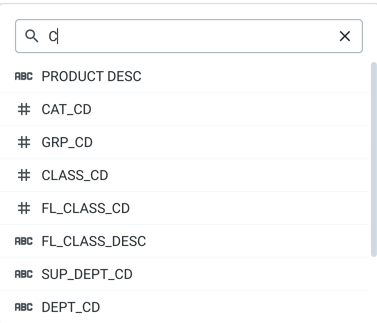
Figure: Find column search bar
Use the up and down arrows to view the list of the columns in the dataset.
You can start typing a column name to filter the list.
Note
An imported dataset requires about 15 rows to properly infer column data types and the row, if any, to use for column headers.
Column Information
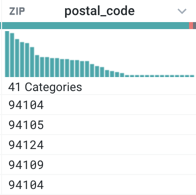
Figure: Column header, data quality bar, and histogram
In the column header, counts reflect only the counts in the currently loaded sample. They do not reflect counts across the entire dataset, unless the entire dataset is the sample.
There are some limitations on column names. For more information, see Rename Columns.
Item | Description |
|---|---|
Data type | Identifies the selected data type, which can be inferred by the application based on the contents of the column. Click the icon to change the data type. Tip Before you start performing transformations on your data based on mismatched values, you should check the data type for these columns to ensure that they are correct. For more information, see Supported Data Types. See Supported Data Types. |
Column name | To change the column name, select Rename... from the column menu. |
Column menu | Depending on the column data type, you can select from a set of predefined recipe steps in the column menu under the caret on the right side of the menu. See Column Menus. |
Data quality bar | The horizontal line shows valid, missing, and mismatched values in the column compared to the column's data type. Tip You can click these colored bars to generate suggestion cards for transformations to act on these types of values. See Data Quality Bars. |
Column histogram | For each column, you can see the range and frequency of values in the column. Tip You can select one or more values a histogram to generate suggestion cards. See Column Histograms. |
Selecting columns
Through the Column Browser, you can use data quality bars and data type information to perform basic review of data across many columns. You can use these tools to select data of interest for display in the data grid or Column Details views or to prompt for suggestions of recipe steps.
Selecting values
You can click and drag to select values in a column:
Select a single value in the column to prompt a set of suggestions.
Select multiple values in a single column to receive a different set of suggestions.
Double-click to select an individual word, and triple-click to select an entire cell value.
When you select values, some values in other columns may be highlighted in a darker color, which provides some indication of correlation between values.
Row Information
On the left side of the screen, you can see a column of black dots. If you hover over one of these, you can see the current row number and, if the information is still available, the row number for the row from the original source data. These values apply only to the sample in the current dataset.
Tip
To review the original row number for a row, hover over the black dot in the data grid. These values can be referenced using the $sourcerownumber reference in your recipe steps. Some transformation steps, such as pivot and union, may make the original row information invalid or otherwise unavailable, which disables this option. See Source Metadata References.
Filter Data Grid
From the Filters drop-down, you can define filters to apply to columns, rows, or both in the data grid. See Filter Panel.
Transformation Preview
Before a transformation in development has been added to the recipe, a preview of the results is generated in the data grid. See Transform Preview.
Target Matching Bar
When a target has been assigned to your recipe, you can review the column names and data types that are expected for the target in the Target Matching bar above the column histograms.
You can assign a dataset to be the target for the recipe you are constructing. This imported dataset, reference dataset, or recipe output contains the set of columns to which you are targeting your wrangling activities. When a target has been assigned, it is displayed in the data grid and column browser to assist you in defining your wrangling steps to match the target.
For more information, see Overview of Target Matching.
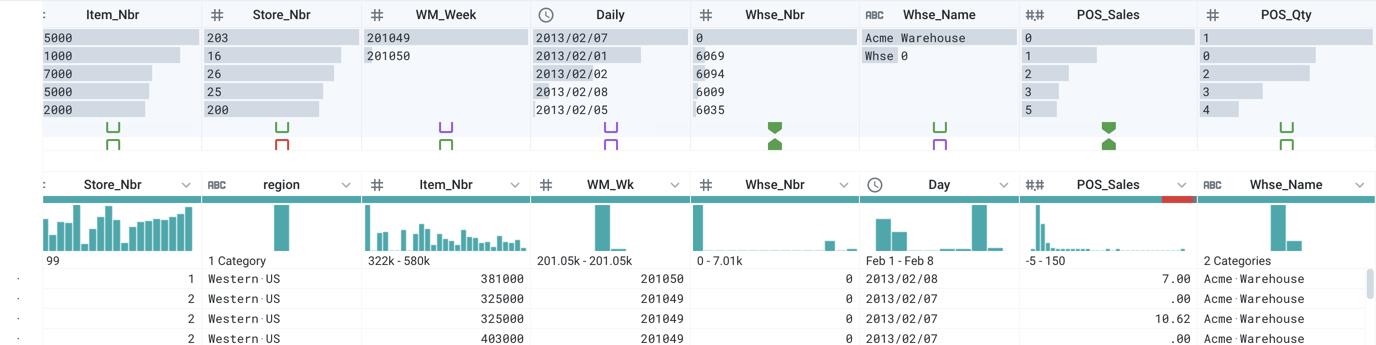
Figure: Target Matching Bar
In the Target Matching bar, you can review how the target above matches the current recipe below. For each column, matching assesses:
Current column name vs. target column name
Current column data type vs. target column data type
Current column position vs. target column position
Current column values vs. target column values
Tip
Two solid green schema tags indicate a perfect match based on the above conditions.
Actions:
If you hover over the schema tags between a column and the target above it, you can review the detected differences between the target and the current column and select actions to fix any differences.
Click the schema tag to auto-fix a mismatch or to select the column with which to match. These actions add a recipe step to create a match between the two columns.
For more information on the schema tags, see Column Browser Panel.