Locate Outliers
Before you begin performing analytics on a dataset, it is important to identify and recognize outlier data patterns and values.
Unusual values or patterns in the data can be sources for the following:
Missing data.
Bad data.
Poorly formatted data
Mismeasured data
Data that skews statistics
This section provides guidance in how to locate these patterns of data in individual columns.
Single-column outliers
For assessing anomalies in individual columns, Designer Cloud provides visual features and statistical information to quickly locate them.
Data Histogram
You can use the data quality bar and histogram to locate unusual values in your column data. The following example illustrates a dataset that contains two columns with outlier data. The first two rows are outliers with the subsequent rows to be consistently patterned data: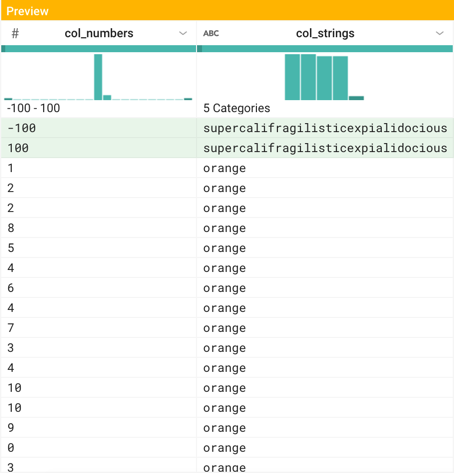
Figure: Numeric and string anomalies
Numeric data
The col-numbers column contains 100 random values 0-10, and singleton values -100 and 100.
In the histogram, you can see the outliers at the extremes of the graph. Note the slight visual distinction between the two extreme values and the values next to them, which are not represented in the column data.
Tip
In a histogram for numeric data, the spread between the extreme values and the more frequent values is a visual cue for outliers.
For numeric data, the range of values is displayed as part of the histogram. In this dataset, the extreme values are singletons. If a dataset contains more instances of outlier values, you should investigate further.
Note
In numeric datasets, a high count of outlier values may be statistically significant. You should review those values and related data in other columns before you perform operations to change or remove those rows.
Significant counts of unusual values
When your data contains a significant number of specific values, you should review them to see if the values have meaning. They may be placeholders for missing values.
For numeric data, you should be skeptical of occurrences of the following values:
Suspicious value | Reason |
|---|---|
-1 | In system generated data, |
0 | Some systems will fill missing numeric values with the number 0. You should verify the meaning of the value of 0 in your dataset. |
555-#### | In the United States, the phone number prefix |
65535 | In older versions of Microsoft Excel, 65,535 was the maximum number of rows permitted in a single sheet. Note 65,536 is 216, which is the maximum number of data bits in a 16-bit system. |
2147483647 | This value is the largest positive integer that can be stored in an |
4294967295 | This value is the largest raw value that can be stored in 32-bit systems. If you see these values, the source system may have been unable to represent the true value and wrote this value instead. |
January 1st, 1900 | This value is the earliest date recognized by Microsoft Excel. The true date may not be accurately represented in your data. |
| This value is the earliest date recognized by Microsoft Excel for Macintosh. |
00:00:00 UTC on January 1, 1970 | This value is the earliest recognized date in UTC timestamp values. UTC timestamps are recorded as the number of milliseconds since this moment in time, stored as a signed 32-bit integer. Since datetime values may be represented in many different formats, you should identify these values for the date formats in your dataset. |
03:14:07 UTC on Tuesday, 19 January 2038 | This value is the latest recognized date in UTC timestamp values. Since datetime values may be represented in many different formats, you should identify these values for the date formats in your dataset.
|
String data
The col-strings column contains approximately 25 values for orange, red, green, yellow, and two instances of supercalifragilisticexpialidocious.
Note
For string-based data, outliers can be identified as strings with a low count of instances. These are the shorter stacks in the histogram.
Column Details
In the Column Details panel, you can review detailed statistics on the values in the currently selected column, including data on outliers. In the Transformer page, select Column Details from a column's drop-down.
Tip
In the Column Details panel, you can select specific outlier values, prompting suggestions, which enables you to take action on values identified by the platform as outliers.
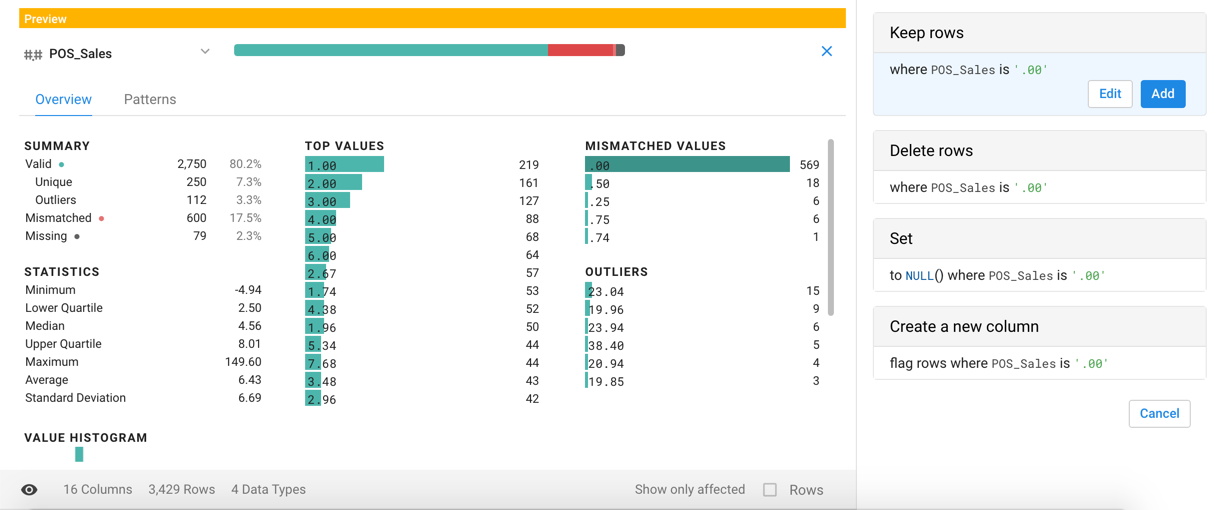
Figure: Outliers in the Column Details
Column Detail Statistics
The Column Details panel provides information on the following:
Count of valid, mismatched, and missing values
Count of value instances
Min, max, and average
Outlier values. See below.
Lowest and highest quartiles
Standard deviation
Note
For string-based data types, these statistics pertain to string length.
Tip
Any green bar in the Column Details panel can be selected to prompt for suggestions on actions, including values in Outliers, Value Histogram, and Frequent Values graphs. Multi-select values as needed.
Outliers
Designer Cloud uses a special set of computations to identify values that it designates as outliers.
For more information on these computations and other calculations in the Column Details panel, see Column Statistics Reference.
Tune standard deviation calculations
Although standard deviation information is available in the Column Details, you may want to generate your own standard deviation calculation. For example, the following transform generates a new column which computes the number of standard deviations that a column value is from the average value for the column:
Transformation Name |
|
|---|---|
Parameter: Formula type | Single row formula |
Parameter: Formula | (col_numbers - AVERAGE(col_numbers)) / STDEV(col_numbers) |
You can then compute your own outlier function, using something like the following, which assumes that the above derived column has been renamed col_numbers_stdev and identifies outliers greater than 4 standard deviations from the average:
Transformation Name |
|
|---|---|
Parameter: Formula type | Single row formula |
Parameter: Formula | ABS(col_numbers_stdev)> 4 |
The above function generates boolean values in a new column, setting the value to true if the absolute value of the standard deviation for the col_numbers_stdev is more than 4. You can then perform operations based on the values written to this column or leave the column in place for downstream analytics tools.
The variance function is also supported.
Methods for fixing single-column outliers
After you have identified the values that are outliers in your column, you must determine if those values are valid or invalid for your dataset. For example, a value of 0 may be a valid measurement, or it may be a value that was inserted for lack of a valid value.
For invalid values:
Fix the values. The fix may require converting the values to be valid for the column's data type. For example, on import, values for
0and1may be written asfalseortrue. The following steps converts them back to numeric values:Transformation Name
Edit column with formulaParameter: Columns
col_numbers
Parameter: Formula
IF((col_numbers == 'false'),'0',col_numbers)
Transformation Name
Edit column with formulaParameter: Columns
col_numbers
Parameter: Formula
IF( (col_numbers == 'true'),'1',col_numbers)
Delete the rows. If the removal of these records does not skew your data, you can create a simple delete statement. For example, the following deletes rows where the value in the
col_numberscolumn is less than25:Transformation Name
Filter rowsParameter: Condition
Custom formula
Parameter: Type of formula
Custom single
Parameter: Condition
col_numbers < 25
Parameter: Action
Delete matching rows
For valid values:
Let them be. If the data is valid, do not remove it unless you have an explicit reason for doing so.
Convert to more meaningful values. You can use the set transform to change outlier values to values that are valid for purposes of analysis.
Note
Please be aware that changing of values may impact the validity of your statistical analysis.
Example of overwriting values where values in the
col_numberscolumn that are below25are set to the average value for the column. Otherwise, use the current value:Transformation Name
Edit column with formulaParameter: Columns
col_numbers
Parameter: Formula
IF((col_numbers < 25), AVERAGE(col_numbers), col_numbers)