Column Details Panel
In the Column Details panel, you can review additional details about a column of your dataset. Select Column Details from any column menu or the Action menu in the column browser.
Tip
Use the Column Details panel to explore values in an individual column, when the context of the value is not important for your current exploration. For example, you can identify outlier values for the column or compare the number of unique values to number of rows to determine whether the column could be a key value.
Overview tab
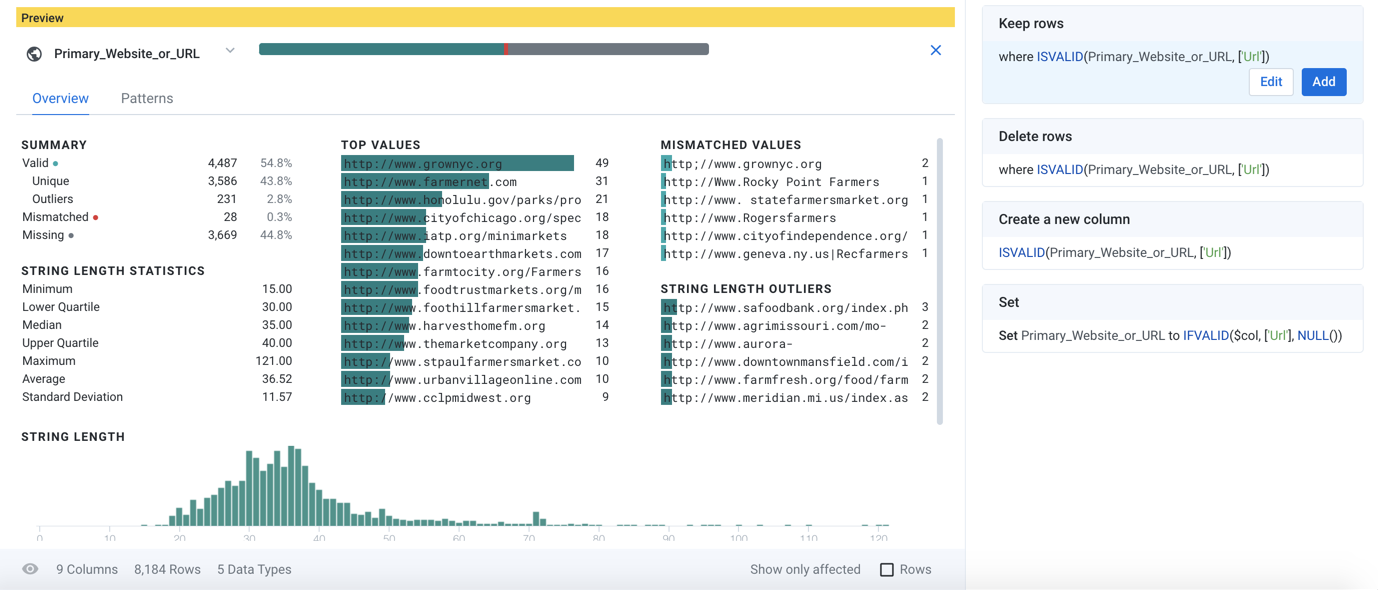
Figure: Column Details panel - Overview tab
Column statistics:
You can use this view to review basic counts and percentages of the values in the currently selected column. In addition to basic computations on valid, mismatched, and missing values, you can see breakdowns for the most frequent values and outlier values.
Note
Before your job is run, profiling information such as column statistics are exact counts of the sample that is currently loaded. After the job is run, profiled results in the Job Results page might include estimates for some metrics and counts, depending on the scale of the dataset.
Depending on the data type of the column, additional statistics provide information on data quality and variation. For more information, see Column Statistics Reference.
Actions:
To change the data type, click the type indicator next to the column title in the Column Details panel.
To perform commands on the column, select from the drop-down next to the column title. For more information, see Column Menus.
Use the data quality bar to select categories of values: valid, mismatched, or missing. The context panel is updated based on your selection with recommended recipe steps. See Selection Details Panel.
Patterns tab
In the Patterns tab, you can review patterns identified by the platform in the selected column's data and then create steps based on patterns that you select. Pattern profiling automatically finds and groups clusters of the column's values based on similarities in format and structure, such as differently formatted phone numbers, addresses, log entries, and name fields. For example, if some of your dataset's address values include apartment numbers, you can create a Split transformation based on a pattern that includes the apartment numbers.
Note
In this tab, the count of values and the all patterns category do not include missing values.
Note
Wide columns, such as Arrays, Objects, or freeform text, might take a while to profile.
Each non-blank value in the column is represented by one of the displayed patterns. Patterns are specified as a combination of literal values and Wrangle . For more information on these patterns, see Text Matching.
Patterns might be more generalized than the constraints of the column's data type.
Token values are Wrangle without braces.
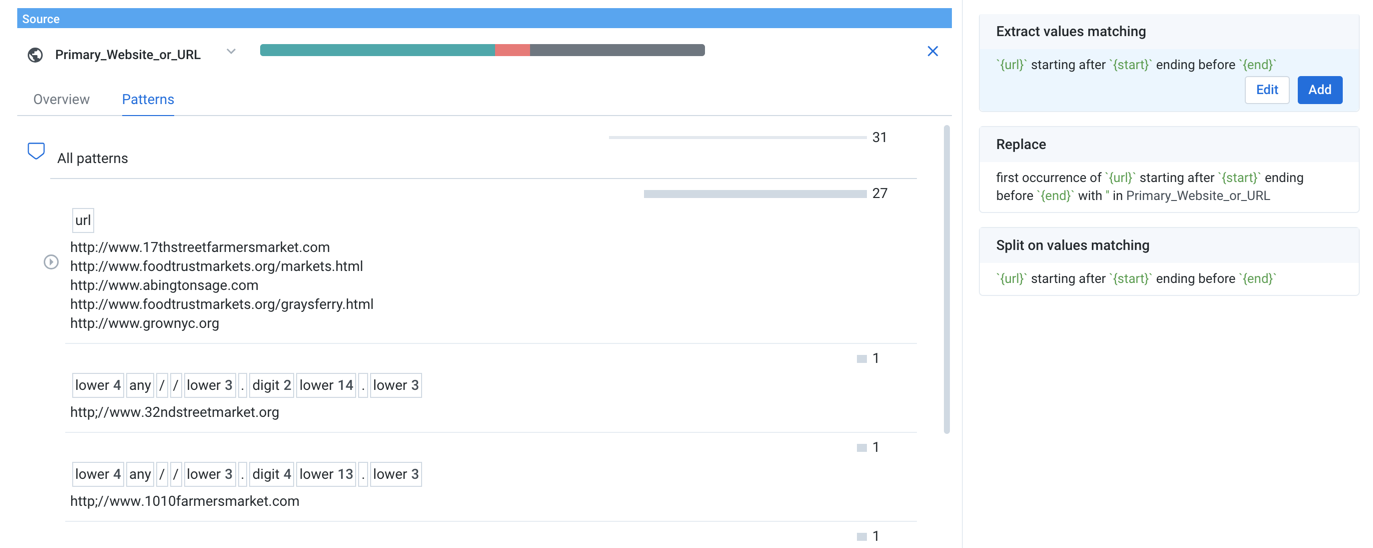
Figure: Column Details panel - Patterns tab
All non-blank values are captured in the all patterns category, which you can expand to display the patterns that capture subsets of all values. Patterns are displayed in a tree structure, with each lower level describing a subset of the parent pattern.
Tip
Hover over a pattern or sub-pattern to see the affected values in the example data beneath it.
Tip
When you select a pattern group, you may be presented with suggestions for standardizing the values in the column to a single format. In some cases, you might want to remove unnecessary data first. For example, standardization of phone numbers is easier if any +1 country codes are removed from the beginning of values.
Tip
Pattern suggestions are created based on the first few thousand rows of data in your sample. For best results, you should generate a random sample with a representative set of patterns in the first rows in the column.
Below the top level, patterns are displayed in order of decreasing frequency in the column, allowing you to choose the level of granularity for which you wish to address data issues in the column. For each pattern, you can review the counts of values matching the pattern.
In the above example, all values that have been identified as matching the urlWrangle are contained in the first category.
Select a pattern to trigger a set of suggestion cards to apply to the represented data.
When you select values from a pattern's histogram, all suggestions match the pattern. You cannot select the values that do not match the pattern from the histogram.
For more information, see Explore Suggestions.
Select a token within a pattern or a highlighted block of text among the example values to trigger suggestion cards that apply the token within the pattern.
You can modify the selected suggestion in the Transform Builder. See Transform Builder.
When you apply the transformation to your recipe, the Patterns tab is updated automatically.
Tip
When you see a pattern that you wish to reuse, select the pattern and one of its suggestion cards and then modify the step.
Expand the caret next to any pattern to explore its sub-patterns, which identify subsets of values within the broader pattern.
Note
The
Otherpattern is a special category that contains values and counts not recognized by the currently selected pattern or sub-pattern. For example, when you selecturlpattern, theOtherpattern captures the non-URL values. When you explore a sub-pattern of URLs, theOthercategory captures the values not recognized within the sub-pattern.
For more information on pattern standardization, see Standardize Using Patterns.
For more information on standardizing numeric values, see Normalize Numeric Values.
Pattern reuse
After patterns have been selected, they can be reused through the Transform Builder.