One Tool Example
Summarize has a One Tool Example. Visit Sample Workflows to learn how to access this and many other examples directly in Alteryx Designer.
Use Summarize to perform various Actions (functions and calculations) on your data. The Summarize tool can...
Return the sum for a column of data. The sum is calculated by adding all of the rows in the column.
Return the minimum or maximum value in a column.
Count the number of rows in a column.
Group a column of data by identical values.
Concatenate string values.
Perform a variety of mathematical calculations.
Perform spatial object processing.
Go to Summary Actions for a complete list.
Tool Components

The Summarize tool has 2 anchors:
Input anchor: The input anchor connects to the data you want to perform actions on.
Output anchor: The output anchor displays only the results of your actions. Use the Join tool to join the results of a Summarize tool with the original data.
The Summarize tool Configuration window has 2 sections: Fields and Actions.
The names of the data fields from the input, and their associated data types, are listed in the Fields section of the tool configuration window.
Select a field to perform an action. Shift + select to choose multiple fields to execute the same actions. Use the Select dropdown above the Fields section to make bulk field selections. Choices include...
All: All fields are selected.
None: No fields are selected. Any previously selected fields are deselected.
Numeric: Only fields with a numeric data type are selected (integers, fixed decimals, floats, doubles.)
String: Only fields with a string data type are selected.
Spatial: Only fields with a spatial data type are selected.
With your fields selected, select the Add dropdown above the Actions section. There are various actions to choose from. Actions are not available if they are not compatible with the selected data types.
Select the action that you want to perform. Your fields are added to the Actions section.
You can perform multiple actions on a single field. To do so, select and add the field once per each action that you want to perform.
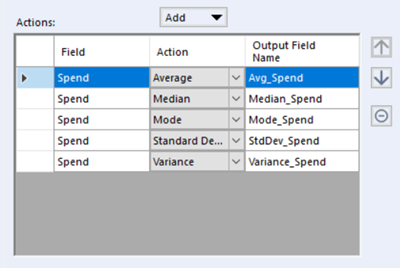
The Actions section contains data fields added from the Fields section. Several options are available once fields have been added to the Actions section:
Reorder: Select a field and use the up or down arrow buttons to change the order of the fields. This will also update the field order of the tool output in the Results window.
Remove: Select an action field and use the remove button to remove the action from the Actions section.
Change Action: To change the action, select the dropdown in the Action column and choose a compatible action.
Rename Output Field: To rename a field, first select the field and then input a new name into the Output Field Name column.
Note
Percentile, Concatenate, and most Finance actions require you to specify additional properties.
When additional properties are required, specify these via the Properties section at the bottom of the tool Configuration window. Go to Summary Actions for information on specific properties.
If additional properties are not required, the Properties section will not be available.
This list describes the types of summary actions that the Summarize tool can perform:
Group By: Combines database records with identical values in a specified field into a single record. All of the resulting data from the records in a group are then summarized. Any non-blob or spatial object has this option. If no Group by field is specified, the entire file will be summarized.
Sum: Returns the sum value for the group. The sum is calculated by adding all of the values of a group.
Count: Returns the count of records in the group.
Count Non Null: Identical to Count, except it is only counting those records that are not null. Null means there is no value set for the record. This is different than a zero or an empty string.
Count Distinct: Returns the count of unique records in the group.
Count Distinct Non Null: Identical to Count Distinct, except it is only counting those records that are not null. Null means there is no value set for this record (different than a zero or an empty string).
Count Null: Identical to Count, except it only counts those records that are null. Null means there is no value set for the record. This is different than a zero or an empty string.
Min: Returns the minimum value.
Max: Returns the maximum value.
First: Returns the first record in the group, based upon its record position.
Last: Returns the last record in the group, based upon its record position.
Net Present Value (NPV): Calculate the net present value of an investment. NPV is a measure of future cash flow over the life of an investment. NPV Parameters:
Discount Rate (Per Period): The discount rate as a percentage. The default value is 8%.
Net Present Value w/ Dates (XNPV): Calculate the Net Present Value for an investment with dates. XNPV Parameters:
Finance Rate: The finance rate as a percentage. The default value is 8%.
Date Field: The field containing the associated dates.
Internal Rate of Return (IRR): Calculate the internal rate of return for an investment. IRR is the expected annual compound rate of return that an investment will earn.
Internal Rate of Return w/ Dates (XIRR): Calculate the internal rate of return of an investment with dates. XIRR Parameters:
Date Field: The field containing the associated dates.
Modified Internal Rate of Return (MIRR): Calculate the modified internal rate of return of an investment. This is a modification of IRR and as such aims to resolve some problems with the IRR. MIRR Parameters:
Finance Rate: The finance rate as a percentage. The default value is 8%.
Reinvest Rate: The reinvestment rate as a percentage. The default value is 8%.
Modified Internal Rate of Return w/ Dates (MXIRR): Calculate the modified internal rate of return for an investment with dates. MXIRR Parameters:
Finance Rate: The finance rate as a percentage. The default value is 8%.
Reinvest Rate: The reinvestment rate as a percentage. The default value is 8%.
Date Field: The field containing the associated dates.
Average: Calculates an average value for the group. The average is calculated by taking the sum of all values divided by the total number of values. Please note that this calculation excludes null values.
Percentile: Calculates the specified percentile value for the group. The percentile is calculated by sorting the data and returning the row value relative to the specified percentile and its position in the sorted array - the largest value is the 100th percentile, the lowest value is the 0 percentile, the median is the 50th percentile, the 25th percentile is the value in the middle of the median and minimum, etc. Percentile properties include:
Specify the percentile to return. The default value is 50%.
Median: Calculates the median value for a group. The median of the group is the middle value when the values are sorted in order. If there is an even number of values there is no number in the middle so the two numbers in the middle are averaged.
Mode: Calculates the mode value for a group. The mode of a set of numbers is the smallest number that occurs most often in a group of values. If all values are unique, the smallest number will be returned.
Standard Deviation: Calculates the standard deviation for the group. Standard Deviation is a measurement variability used in statistics.
Variance: Calculates the Variance for the group. The variance is calculated by taking the Standard Deviation and multiplying it times itself (StdDev2).
Ignore 0's: Calculates the Numeric processes described above ignoring records that have a value of zero.
Count Blank: Counts how many records in a group have a blank or empty value.
Count Non Blank: Counts how many records in a group do not have a blank or empty value.
Concatenate: Takes all the records in a group and concatenates the strings. Concatenate Properties include:
Start: The character specified will appear at the beginning of the concatenated string. It is left blank by default.
Separator: The character specified will appear in between each value of the concatenated string. The default is a comma.
End: The character specified will appear at the end of the concatenated string. It is left blank by default.
Important
The start, separator, and end elements must be specified for each field that an action is being applied to. You can enter any character or string, or leave them blank. Supported escape characters include: \n (new line), \t (tab), \r (carriage return), and \s (whitespace character).
Longest: Returns the longest string value of the group.
Mode: Returns the mode of the string values. The mode of a set of string values is the smallest string that occurs most often in a group of values. If all values are unique, the smallest string is returned. The smallest string is the first in ascending sort order.
Shortest: Returns the shortest string value of the group.
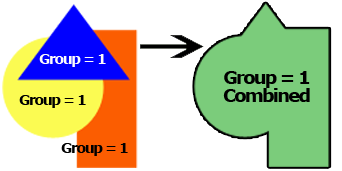
Combine: Combines the area of all the spatial objects in a group.
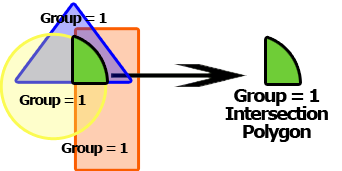
Create Intersection: Identifies all of the overlapping areas of a group's spatial objects and creates a polygon that consists only of that overlap. This means that if the group being summarized contains two polygons that overlap and one that does not, nothing will be returned.
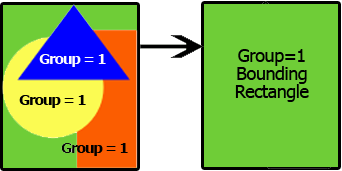
Create Bounding Rectangle: Identifies the geographic extent of all spatial objects in a group and draws a bounding rectangle to those extents.
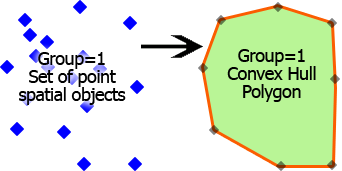
Create Convex Hull: Identifies the Convex Hull of a group of points. The Convex Hull polygon is the smallest convex polygon that can be drawn to include a group of points. The polygon will not contain any concave angles, so it will never turn in on itself.
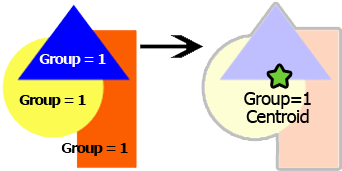
Create Centroid: Identifies the geographic center of a group of spatial objects.
Combine Horizontal: Combines all the Report Snippets in a group into a single snippet for the group laid out horizontally.
Combine Vertical: Combines all the Report Snippets in a group into a single snippet for the group laid out vertically.
Use the Summarize tool to sum the values in a field or column of data. The sum is calculated by adding all of the rows in the column.
In the Fields section, select the column that you want to sum.
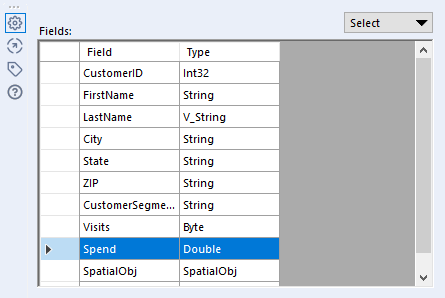
Select the Add dropdown and select the Sum action to add the previously selected column to the Actions section.

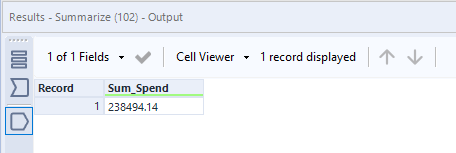
Run your workflow to see the sum of the selected column in the Results window.
Use the Summarize tool to return each unique value in the specified column (field).
In the Fields section, select the column that you want to group by.
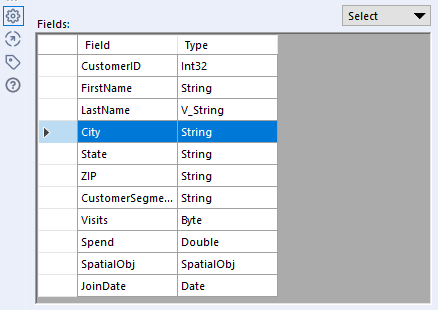
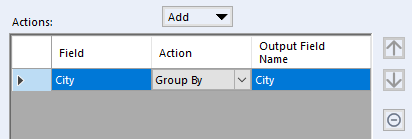
Select the Add dropdown and select the Group By action to add the previously selected column to the Actions section.
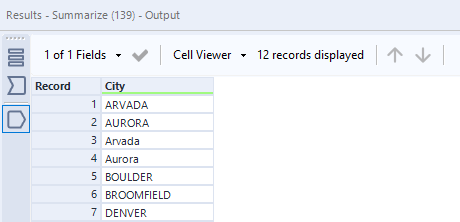
Run your workflow to see each unique value in the selected column in the Results window. Note that the Summarize tool is case sensitive, so ARVADA and Arvada appear as separate values.
To see additional examples of the Summarize tool, open Designer, and in the Tool Palette, select Transform > Summarize. You will see a pop-up message that provides additional information about the Summarize tool. Select Open Example to open a sample workflow that showcases several uses of the Summarize tool. Run the workflow and select a tool to view its output in the Results Window.

