Analyze across Multiple Columns
This section describes some techniques for performing analysis across data stored in multiple columns.
For example, you may want to analyze combinations of height and weight. Some options:
Consolidate dimensions to a single metric. For example, height and weight can be combined using a BMI (body mass index) calculation. Then, use available outlier analysis capabilities in Designer Cloud. Below, you can review a method for bringing together similar data from multiple columns into a single column for easier analysis.
Flag outlier values of individual columns, perhaps giving each column a weighting factor (e.g. 0.5). Sum the outliers and their weights together.
Defer analysis until the data has arrived in the target system.
If you have homogeneous data across multiple columns, such as multiple individual events recorded in a single row, you can use a different method to calculate metrics. See Calculate Metrics across Columns.
In some cases, you may need to identify outliers across multiple columns of data. For example, you have a dataset containing scores from three separate tests taken by a set of individuals. Your columns may look like the following:
LastName
FirstName
TestScore1
TestScore2
TestScore3
You can download theDataset-TestScores.csvdataset.
Most calculations, such as standard deviation, work for a single column of data. To perform analysis across all three columns, you must reshape the above dataset to look like the following:
LastName
FirstName
TestNumber
TestScore
This steps below outline the steps for this example. The full recipe is provided at the bottom of this section.
Steps:
Load the TestScores dataset into the Transformer page. It should already be split out into five separate columns.
The three columns listed side by side are data that has been organized in a pivot table. To break down this data, you must unpivot the data, which breaks down the data into a
keycolumn (containingTestScore1,TestScore2,TestScore1) and avaluecolumn, which contains individual test scores.Transformation Name
Unpivot columnsParameter: Columns
TestScore1,TestScore2,TestScore3
Parameter: Group size
1
Rename the generated column of test scores to
TestScore.The numeric information in the
keycolumn values can be extracted using the following:Transformation Name
Extract text or patternParameter: Column to extract from
key
Parameter: Option
Custom text or pattern
Parameter: Text to extract
`{digit}`The
key2column contains just the numeric data now. Rename this column toTestNumber. You can delete thekeycolumn now.The dataset does not contain a primary key, which field containing a unique identifier for each row. The combination of last name, first name, and test number is a unique identifier for each row in the dataset:
Transformation Name
Merge columnsParameter: Columns
LastName,FirstName,TestNumber
Parameter: Separator
'-'
Rename the new column to
TestID. Typically, primary keys are listed as the first field in a dataset. You might want to move the column before theLastNamecolumn.You may have noticed that the data is still organized by name (first and last) and test number, so that an individual's tests are scattered throughout the dataset. To reorganize the information, you can re-aggregate the data using the following:
Transformation Name
Pivot tableParameter: Row labels
LastName,FirstName,TestNumber,TestID
Parameter: Values
SUM(TestScore)
Parameter: Max number of columns to create
1
Tip
The above retains all instances of tests that have been taken. If you are only interested in the average test score, you can remove the
TestNumberandTestIDgroupings and the change theSUMfunction toAVERAGE. In the results, you have one average for each test taker.You may want to rename the aggregation column. Your final dataset should look like the following:
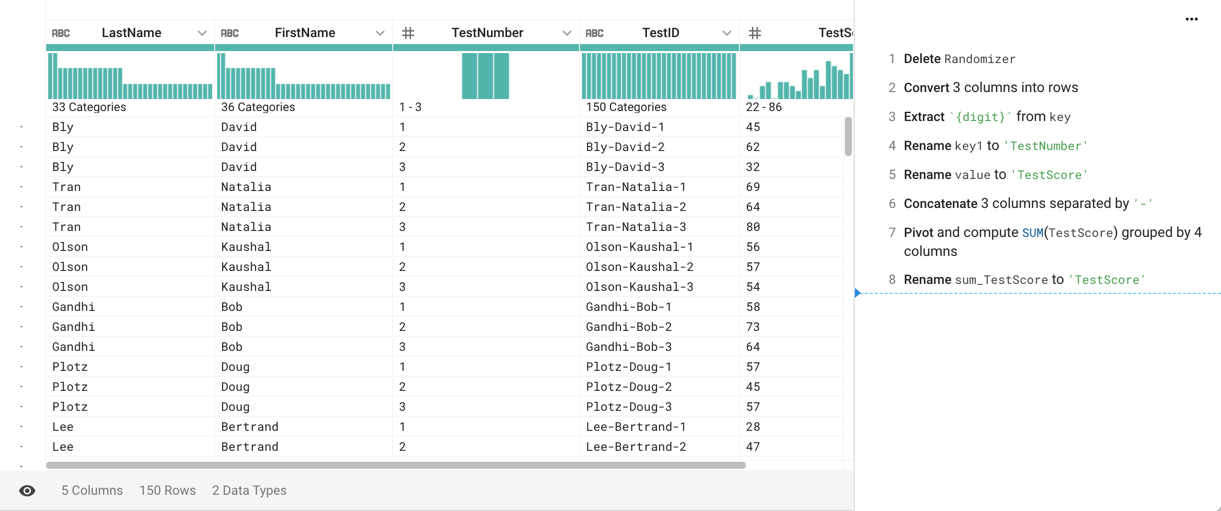
Figure: Single column of test scores
Now that your columns of data have been consolidated to a single column, you can use the single-column transforms and functions to perform analysis, such as locating outliers.