Transformer Page
In the Transformer page, you identify the data that you need to transform and build your transformation recipes on samples taken from your currently selected dataset.
When you make changes to your transformation recipe, those changes are immediately applied to your sample, so that you can preview the results of your recipe before you run it against the entire dataset. In this manner, you can quickly build and iterate on the transformations applied to your data.
In the Library for Data page, click the name of the dataset. See Library for Data Page.
By default, Designer Cloud selects the first N of row data as the head sample. The number of rows depends on the number of columns, data density, and other factors. Depending on the size, this sample may be the full dataset.
For more information, seeOverview of Sampling.
Data not displayed: From Flow View you can choose to edit your recipe without loading a sample for faster editing. You can select a different sample with the data grid off. If needed, click Enable data grid to load the currently active sample.
Note
This feature can be enabled or disabled by an administrator.
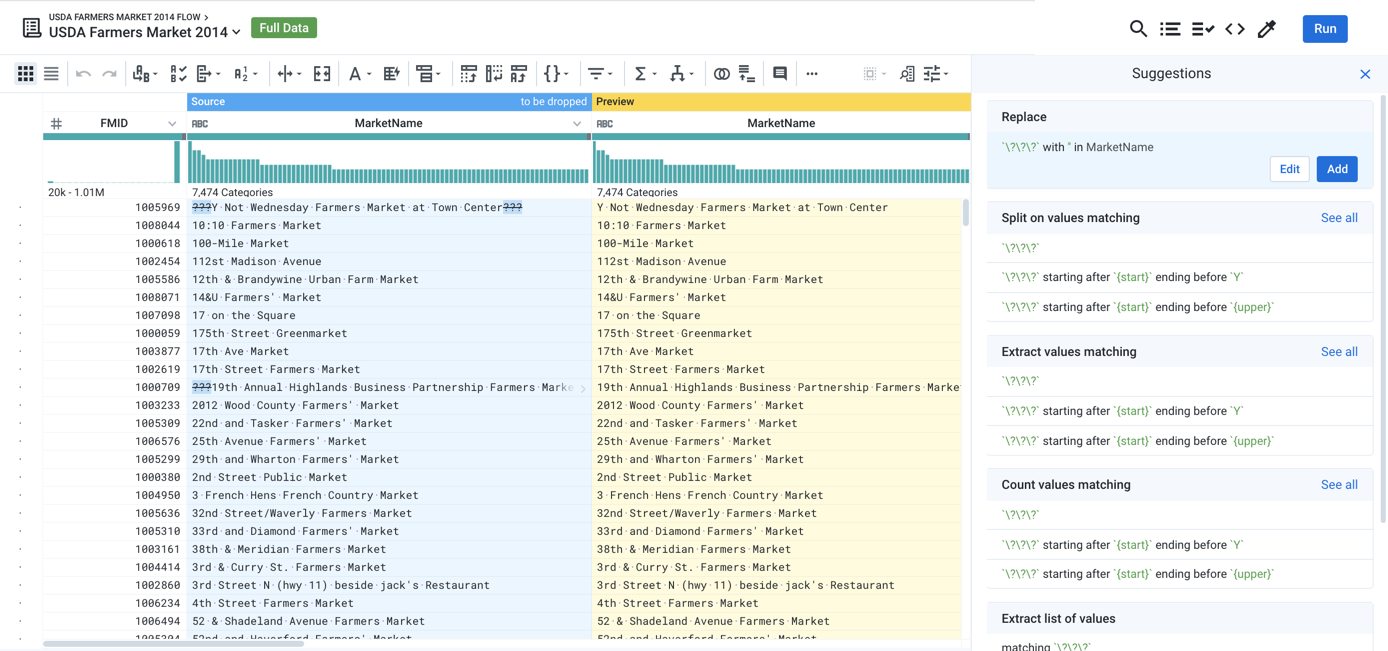
Figure: Transformer Page
Page Uses
Tip
When keyboard shortcuts are enabled, press ? in the application to see the available shortcuts. Individual users must enable them. See User Profile Page.
Identify and Select Data
In the main panel of the Transformer page, you can select one or more elements of sampled data, which prompts suggestions for steps that you can apply to transform them. Each of these views provides a different perspective on your data, and the results of any subsequent steps that you select or configure are previewed by default in the data grid:
Note
Before your job is run, profiling information such as column statistics are exact counts of the sample that is currently loaded. After the job is run, profiled results in the Job Results page might include estimates for some metrics and counts, depending on the scale of the dataset.
Tip
Click one or more column headings to be prompted for suggestions that apply to the selected column or columns.
Panel | Description | Recommended Uses |
|---|---|---|
A toolbar of common transformations, filters, and other operations. | Use the tools in these drop-downs to quickly build common recipe steps. | |
By default, the Transformer page displays previews in a columnar grid, which is the default view. Click Grid. | Use for examining values in a column with appropriate surrounding context. How do missing values in one column compare to values in another column? | |
For additional statistical information on individual columns, select Column Details from the drop-down next to the column title. | Explore values in an individual column, when their context in other rows is not necessary. Useful for managing outliers, reviewing mean, min, and max values. | |
Use the Column Browser to select the columns to display and review data across columns. Click Columns. | Navigate between columns and toggle their display in the data grid. Good for high-level perspective. Use histograms for selection of ranges of values. | |
Depending on the state or the current selection of the data grid, the right side of the page displays one of several contextual panels. These panels cover recipes, suggestions, steps, and more. See below. | Review recipe and edit, create, or delete recipe steps. Review and create samples. |
Get Statistics
You can use the following methods for acquiring statistics on your dataset sample or individual columns in your sample:
Sample Indicator: At the top of the data grid, you can see the name of the sample currently displayed in the grid. For smaller datasets, this sample is the entire dataset. Click this name to display statistics about the currently loaded sample. See Sample Indicator.
Status bar:At the bottom of the page, you can review the number of data types and rows and column information for the sample currently displayed in the data grid. These metrics are updated based on the recipe steps that you apply to the sample. For more information, see Data Grid Panel.
Column statistics: You can review basic statistics on individual columns.
Select a column in the data grid. Column information is displayed in the context panel.
You can also click the Columns icon at the top of the data grid to select your column to review detailed statistics. See Column Browser Panel.
Profile your data: When you run a job on your dataset, you can optionally generate a visual profile of the resulting output. A visual profile can be useful for identifying key metrics on individual columns. SeeJob Details Page.
Computed statistical functions: As needed, you can generate aggregated statistics as part of your recipe. See Aggregate Functions.
Context Panel
The following actions are applied through the context panel on the right side of the screen. See Context Panel.
Build Recipes
Use the following methods to add or modify recipe steps in the Transformer page:
Tip
To add a new recipe step, press CTRL/COMMAND+ K. Enter a search string for your transformation step.
Suggestion Cards: When you select data in the Transformer page, a set of suggested transformations is displayed in cards. Select the appropriate one to preview the results in the data grid. Then, add or edit the selected transformation. See Selection Details Panel.
Transformer Toolbar: Select data in the data grid or column browser and then choose your transformation from the Transformer toolbar. The Transform Builder is pre-populated with your transformation. See Transformer Toolbar.
Search panel and Transform Builder: Click the + icon in the Transformer page and use the Search panel to locate your preferred transformation. See Search Panel.
Complete the transform definition in the Transform Builder. See Transform Builder.
Recipe Panel: After recipe steps have been created, you can review and edit them through the Recipe panel. See Recipe Panel.
Transform Preview: Before a transform step has been added to the recipe, a preview of the transform is displayed in the data grid. See Transform Preview.
Generate Samples
For larger datasets, the Transformer page displays a sample of them, which you use as representative data to build your recipe. As needed, you can generate a new sample, which is useful for polishing your recipe.
Warning
The data that is displayed in the data grid is based on all of the upstream samples after which all subsequent steps in each upstream recipe are performed in the browser. If you have a large number of steps or complex steps between the recipe locations for your samples in use and your current recipe location, you may experience performance slow-downs or crashes in the data grid. For more information on sampling best practices, see https://community.trifacta.com/s/article/Best-Practices-Managing-Samples-in-Complex-Flows.
For more information, seeSamples Panel.
Assess Data Quality
Through the context panel, you can build rules that test the quality of your data. For each rule that you create, a data quality bar displays the count and percentage of rows that pass (green) or fail (red) the rule.
Note
Data quality rules are not transformation steps. In the Transformer page, they assess the current quality of the sampled data and can be used as the basis for building transformation steps to clean up issues raised by the rules.
For more information, see Data Quality Rules Panel.
Launch Jobs
Run jobs: To run a job that executes the transform recipe currently in the Transformer page across the entire dataset, clickRun. SeeRun Job Page.
Transformer Bar
The Transformer page contains menus that are different from the standard Alteryx menu bar.

Figure: Transformer page toolbar
Flow name: Click to review flow details. See Flow View Page.
Dataset menu: Click the caret next to the flow name to open.
Review the datasets in the flow or open a different wrangled one.
See a mini-map of flow view for the flow.
See Recipe Navigator.
Samples: Click the description of the current sample to review and create new samples from your dataset. SeeSamples Panel.
Search icon: Search for transformations to add to your recipe.
Recipe icon: Display the current recipe. See
Flow Parameters icon: Review, create, and modify the parameters of your flow. See Manage Parameters Dialog.
Samples icon: Click the dropper icon to review and create new samples. SeeSamples Panel.
Run:Runs the currently specified recipe on the dataset. SeeRun Job Page.