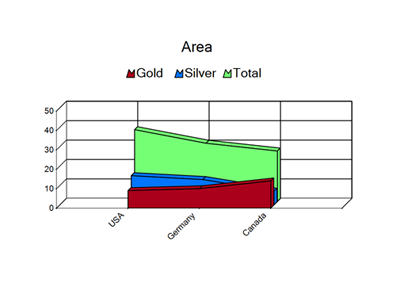
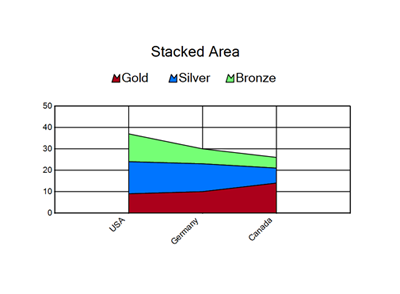
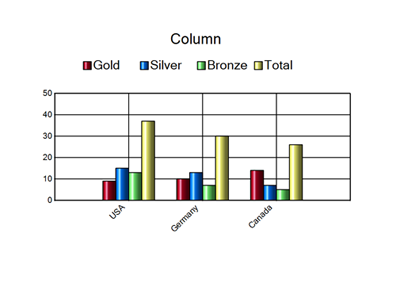
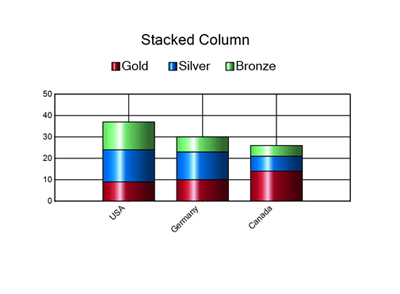
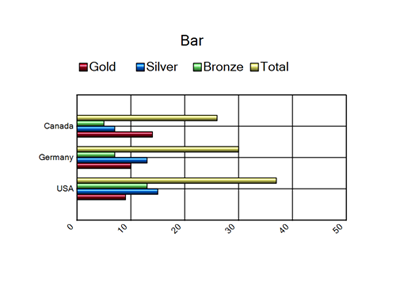
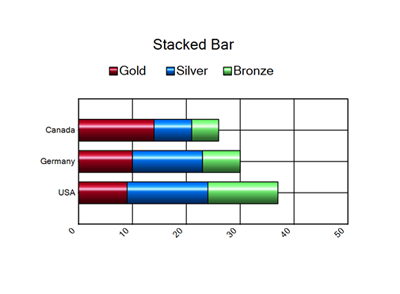
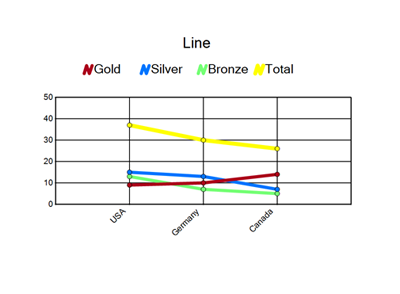
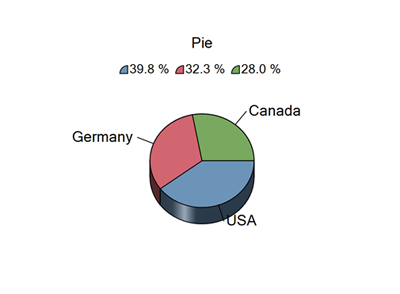
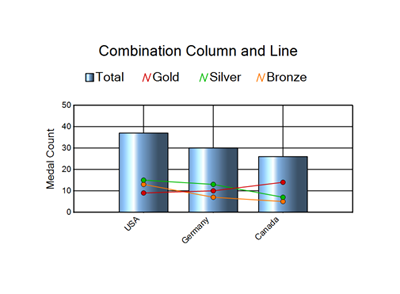
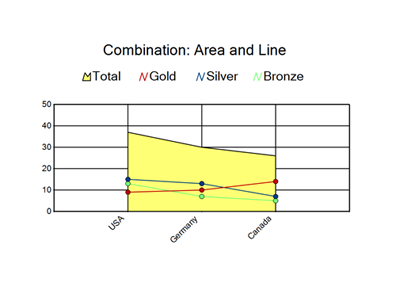
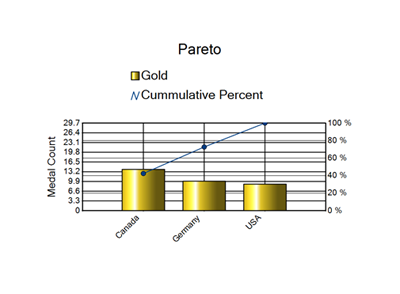
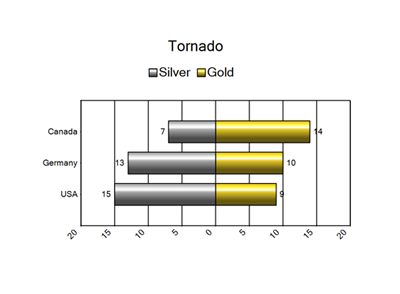
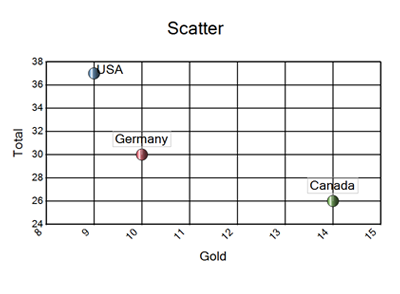
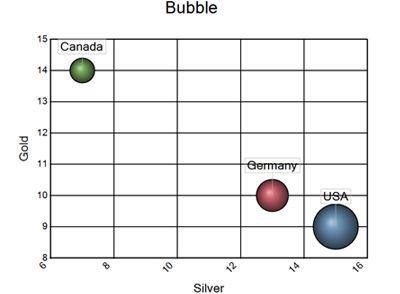
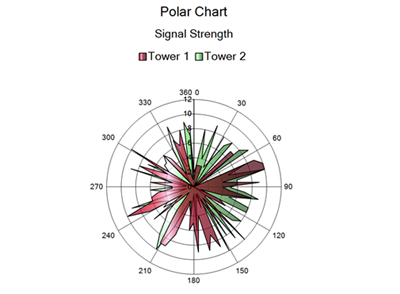
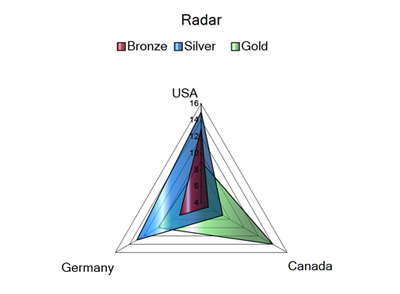
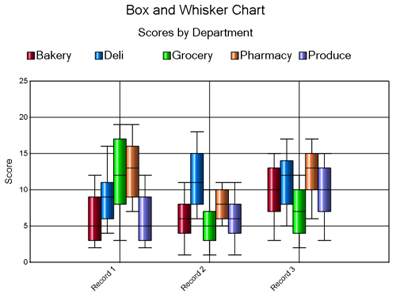
2023.2DesignerOutilsGénération de rapports Charting Tool Chart Types Chart Types The following images show the types of charts the Charting tool can configure. Area Stacked Area Column Stacked Column Bar Stacked Bar Line Pie Combination Column and Line Combination Area and Line Pareto Tornado Scatter Bubble Polar Chart Radar Box and Whisker Chart