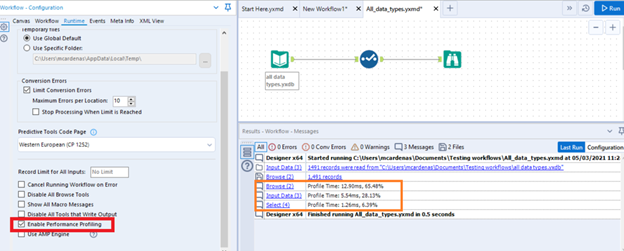
Performance Profiling with AMP Engine
Performance Profiling in Designer allows you to see the execution time for each tool relative to the workflow's overall execution.
The original Engine returns the time, in milliseconds, that each tool took to run, measured to 0.01 ms precision. AMP can also have multiple workers for each tool, but the total time is combined per tool.
AMP Profiling Highlights
The performance profiling results between the original Engine and AMP shouldn`t be compared, since the engines work differently. AMP uses many threads to execute tasks, but the total time is summed by counting every thread used for the tool.
Overall time per tool might be more than the total workflow time due to the multi-threaded nature of AMP.
When there is not enough memory to execute a workflow, AMP performs additional memory management that is reported as a separate message: "Nms have been spent on memory management. M% of the total workflow execution time."
Performance Profiling is a good way to identify which parts of the workflow are suitable for optimization. You can...
Adjust the Memory Limit in Workflow Configuration - Runtime and use a specific amount.
Replace tools with long execution times with other suitable tools, or a combination of tools.