 Browse Tool
 Browse Tool
User Role Requirements
User Role* | Tool/Feature Access |
|---|---|
Full User | ✓ |
Basic User | ✓ |
*Applies to Alteryx One Professional and Enterprise Edition customers on Designer versions 2025.1+.
Use Browse to view data from a connected tool. You can see data Profile information for multiple columns at once in a single holistic view, or for a single column of data. You can view information on data type, number of records, data quality, and a variety of statistics.
When a spatial, report, or behavior analysis data type is connected, an additional tab is available in the Browse tool. This tab shows a preview of the actual object on a Map or a Report.
One Tool Example
This tool has a One Tool Example. Go to Sample Workflows to learn how to access this and many other examples directly in Designer.
Tool Components

The Browse tool has 1 anchor.
Input anchor: Use the input anchor to connect to the data that you want to display via the Browse tool.
Configure the Tool
Add the Browse tool to your workflow. There are 3 ways to do this:
Drag a Browse tool to the canvas, and connect it to an upstream tool.
Right-click on a tool on the canvas and select Add Browse After.
Use the Shift+Ctrl+B keyboard shortcut and select the tools in a workflow.
Connect the Browse tool to the output anchor of the tool that contains the data that you want to view in detail.
Disable Browse Tools in Workflow
Without a Browse tool, the Results window displays up to 1 MB of data from a tool, by default. You can disable the Browse tool if you don't want to store the entire dataset in memory. To disable Browse tools...
Select a random point on the canvas to display the Workflow - Configuration window.
In the configuration window, select Runtime.
Check Disable All Browse Tools to make the Browse tools in the workflow unavailable. To enable Browse tools, uncheck Disable All Browse Tools.
Disable Data Profiling
By default, data profiling is enabled. To disable data profiling features, go to Options > User Settings > Edit User Settings > Workflows, and deselect Collect and Display Data Profile Information.
View Data Profile
After you run your workflow, select the Browse tool on the canvas to view data profiling in the tool Configuration window. You can also view data via the Results window.
Holistic View
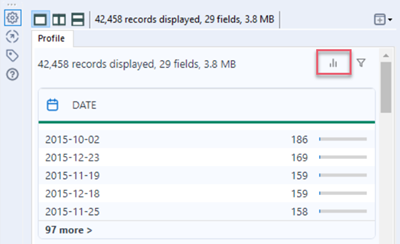
By default, all data columns (fields) display in a single holistic view in the Profile tab of the Browse tool Configuration window. This single view includes a container for each column of data, with the column name, a data quality bar, and a list of the column's top values (if applicable). The column's data type is indicated by an icon to the left of the column name.
Select the holistic view toggle (bar graph icon) to switch between the top values view and the data profiling chart view of the associated data.
Top Values View
By default, the holistic view displays each compatible column's top values and a color-coded data quality bar. The top 5 values and their counts are displayed in each column container.
Select the more > link to view up to 1,000 distinct top values for the selected column.
On the Distinct Values view, select the left-arrow icon to view the data profiling information for the selected column.
If the column's data type is not compatible with data profiling, the No profiling available message displays.
Data Profile Charts View
Select the holistic view toggle to switch from the top values view to the data profiling chart view. This view displays a chart of each compatible column's top 50 values and a color-coded data quality bar.
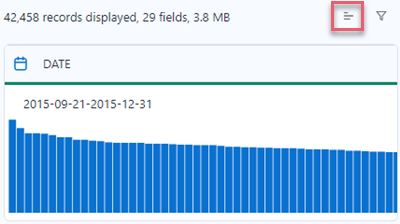
In addition to the chart, more information is available depending on the data type:
For columns with numeric data, a data range displays above the chart.
For columns with string data, the top 50 values display, as well as the number of the total distinct values in that column.
For columns with date, time, and date-time data, a data range displays above the chart.
No Profiling Available
If the column's data type is not compatible with data profiling, the No profiling available message displays.
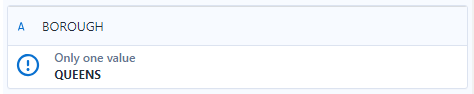
Only One Value (Data Profile Charts)
For columns that contain only one distinct value across all rows, the Only one value message displays.
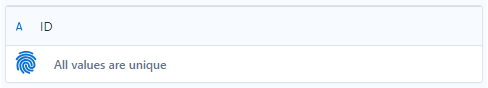
All Values Are Unique (Data Profile Charts)
For columns where each value is unique, the All values are unique message displays.
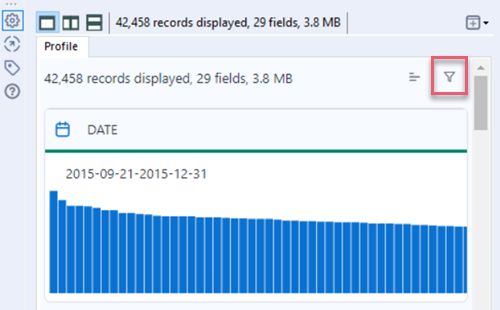
Filter Holistic View
Select the filter (funnel) icon to access filter options for the data profiling holistic view. These filters only apply to the holistic view. If you want to filter your dataset for downstream processing, use the Filter tool.
You can filter based on 2 categories:
Fields: All fields (columns) in your dataset are checked by default. Uncheck fields to remove them from the holistic view.
Data Type: All data types are checked by default. Uncheck data types to remove fields with those data types from the holistic view. Note that all possible data types are listed even if your dataset doesn't include those data types.
Any filters that you apply to the above categories are joined by an and statement. For example, if you decide to only check a field with a Date data type via the Fields filter and also uncheck all data types via the Data Type filter, no data shows in the holistic view.
Select the Reset Filter link to reset the holistic view to its original state. You can also deselect or click off the Browse tool on your workflow canvas to reset the filters.
Single Column View
Select a column name to view only that column's data profile in the Configuration window. To return to the holistic view, in the single column view select the "x" button next to the column name.
Depending on the column's data type, different information is available in the single-column view Configuration window.
When you select a string, numeric, boolean, or date-time data type in the holistic view, the single-column view Profile tab displays summary information, statistics, and a chart for the selected column. You can also select columns in the Results window to view data profile information specific to those columns.
Summary
When applicable, the Profile Summary section displays data Type, number of Records, and Data Type Size fields, as well as this data quality information:
Ok: The number and percentage of values in the column with no identified quality issues, for example, leading or trailing whitespace.
Unique: The number and percentage of unique values in the column. Use the Unique tool to see a full count of unique and duplicate entries.
Null: The number and percentage of values in the column that are null, excluding empty values.
Not Ok: The number and percentage of values in the column with identified quality issues like leading or trailing whitespaces, or embedded newlines.
Empty: For string data types, the number and percentage of values in the column that contain strings with no values. If you convert the string to a different data type, empties are converted to nulls.
Length and Value Statistics
The statistics for the selected column display below the Summary in the Configuration window. Available statistics depend on the data type in the selected column. See Data Types for a list of data types.
The length and value statistics also include a chart for the selected column. The type of chart shown is based on the type of data you select:
Blob: A bar chart of null and not null counts.
Boolean: A pie chart of true, false, and null counts and percentages.
Numeric: A distribution chart that shows counts and percentages for grouped values of a numeric field.
Date, Time, Date-Time: A distribution chart that shows counts for values of date, time, or date-time fields.
Frequent Values
String data types display a Frequent Values chart to indicate the string values that appear most frequently in the column of data. The chart displays up to 50 values.
If the column contains only one value across all rows, the Only one value message displays.
If the column contains a unique value in each row, the All values are unique message displays.
Top Values
String, numeric, and date-time data types display a Top Values list to indicate the values in the column of data that have the highest counts. Select the more link to see up to 1,000 distinct top values. Select the left-arrow button to return to the column's data profile.
Grouped Values for Date-Time
Date, time, and date-time data types display a Grouped Values container with a histogram chart. The chart is configured according to these rules:
If all values lie within a 24-hour range, an hour-based chart is shown.
If all values lie within a 7-day range, a day-based chart is shown.
If all values lie within a 12-week range, a week-based chart is shown.
If all values lie within a 12-month range, a month-based chart is shown.
If all values lie within a 12-quarter range, a quarter-based chart is shown.
Otherwise, a year-based chart is shown.
When a Browse tool is connected to a tool with reporting snippets, the Configuration window displays two tabs: Report and Profile.
Report
The Report tab displays the reporting snippets as they appear in a report. Tools in the Reporting category create reporting snippets. Visit Reporting Tools for more information.
Report view options include...
Fields: Select the Fields dropdown to view a list of report fields displayed in the view. Select the "x" icon to deselect all report fields, and the checkmark icon to select all report fields.
Navigation: Use navigation arrows to view specific records. By default, the Configuration window displays 10 records at a time.
Profile
The Profile tab in the Configuration window shows minimal information, including the number of records displayed, the number of fields, and the data size. Data profiling is available for fields included in the report, but not for the report itself.
When a Browse tool is connected to a tool with spatial data, the Configuration window has two tabs: Map and Profile.
Map
The Map tab in the Configuration window displays a map of the data drawn in spherical Mercator projection.
Map view options include...
Fields: Select the Fields dropdown to view a list of spatial object fields in the view. Select the "x" icon to deselect all spatial object fields, and the checkmark icon to select all spatial object fields.
Pan: Select to pan around on the map by dragging the map to the desired position. Each time the pan is used, the map displays the new map image.
Select: Select objects on the map. When you select map objects, the corresponding data records are also selected and indicated as being selected in the Table and Report views. There are multiple supported selection methods:
Single-click: Select individual objects.
Ctrl + click: Add or subtract to a selection.
Drag: Drag a selection box around the objects to select multiple objects at once.
Zoom in: Select to decrease the map area, producing a more localized map image.
Zoom out: Select to increase the map area, producing a more generalized map image.
Zoom to selection: Select to zoom to a clicked point or a selected area.
Reset view: Select to reset the map view to the original area.
Base map: Select to view and select a reference layer for the map image. Only map file and layer sets currently installed on your computer appear in the dropdown list. Visit Dataset Defaults for more information.
Copy: Select to copy the map image to the clipboard to be pasted into other applications.
Export: Select to save the map image in a supported image file format: .jpeg, .png, .bmp.
Profile
The Profile tab in the Configuration window shows minimal information, including the number of records displayed, number of fields, and the data size. Data profiling is not available for Spatial data.
When a Browse tool is connected to a tool with behavior analysis profile data, the Behavior Analysis tab in the Configuration window displays the XML content of a selected profile field, record-by-record, in a table.
Behavior Analysis view options include...
Profile: Lists profile fields in the data. Only one profile field can be viewed at a time.
Navigation: Select navigation arrows to view specific records. By default, the Configuration window displays 1 record at a time, because a single record contains data on all 60 clusters within the selected profile.
Dataset: Displays the data from which the profile was extracted.
Type | Description |
Demographic | The level of classification with which the profile was built (typically household or adult). |
Primary | If selected, this indicates the primary demographic the profile was built for (typically household, population, or adult). |
Cluster Number | Identifies the cluster. |
Count | Identifies the demographic that meets the profile criteria. |
Base | Identifies the demographic (household or adult) for that particular cluster. |
avgVolume | Identifies the average value calculated by dividing Count by Base for each cluster. Values are null if data is not provided for the cluster. |
Data grid: Displays the cluster data. Use the Behavior Detail Fields tool to add the data available in this tab to a workflow. See Detail Fields Tool.
Data profiling is not available for Behavior Analysis data types.
Configure the View
These options are available in the Configuration window when viewing a single column of data:
Depending on the type of data you are viewing, up to four tabs might display: Profile, Map, Report, and Behavior Analysis. You can view up to 2 tabs at the same time.
Use the view icons to switch between views.
Single View icon: Select to view all tabs in a single window.
Left/Right View icon: Select to view all tabs in the left and right halves of the window. Select different tabs in each window to compare data.
Top/Bottom View icon: Select to view all tabs in the top and bottom halves of the window. Select different tabs in each window to compare data.
Displays the number of records selected in the Results window. Select the "x" icon to clear the selection.
By default, the tool name consists of the tool Type and tool ID. Follow these steps to rename your Browse tool:
Select the Browse tool and in the tool Configuration window, select Annotation.
In the Name field, enter a name for the window.
Select the New Window icon to open data in a new, undocked window. You can choose to show All Records or Selected Records. Selected Records will be inactive if no records have been selected in the Results window.
Data in the window will not change. This allows you to compare views and assess data after modifying and running a workflow. By default, the window name is the tool Name and the tool ID of the Browse tool.
New in 2025.2
Double-click the Browse tool in your workflow to open your data in a new window.
Statistics
The statistics for the selected column display on the Profile tab of the Browse tool Configuration window. The available statistics depend on the data type in the selected column. For a list of data types, go to Data Types.
If the selected column contains string values, these statistics are provided:
Type | Description |
Type | The data type of the selected column. |
Records | The number of rows in the selected column. |
Data Type Size | The amount of memory reserved for each record in this column. |
Ok | The number and percentage of values in the column with no identified quality issues, for example, leading or trailing whitespace. |
Unique | The number and percentage of unique values in the column. Use the Unique tool to see a full count of unique and duplicate entries. See Unique Tool. |
Null | The number and percentage of values in the column that are null, excluding empty values. |
Not Ok | The number and percentage of values in the column with identified quality issues like leading or trailing whitespaces, or embedded new lines. |
Empty | The number and percentage of values in the column that contain strings with no values. |
Min | The number of characters in the shortest value in the column. |
Max | The number of characters in the longest value in the column. |
Average | The average length of values in the column. |
Shortest Value | The shortest value in the column. |
Longest Value | The longest value in the column. |
First Alphanumeric Value | The first string entry in a column that is sorted alphabetically. |
Last Alphanumeric Value | The last string entry in a column that is sorted alphabetically. |
Blanks | The number of empty values. |
Values with Leading Whitespace | The number of string values with whitespace before the value. Use the Data Cleansing tool or the Formula tool trim function to resolve the problem. See Data Cleansing Tool and Formula Tool. |
Values with Trailing Whitespace | The number of string values with whitespace after the value. |
If the selected column contains numeric values, these statistics are provided (rounded to 4 decimal places):
Type | Description |
Type | The data type of the selected column. |
Records | The number of rows in the selected column. |
Data Type Size | The amount of memory reserved for each record in this column. |
Ok | The number and percentage of values in the column with no identified quality issues, for example, leading or trailing whitespace. |
Unique | The number and percentage of unique values in the column. Use the Unique tool to see a full count of unique and duplicate entries. For more information, go to Unique Tool. |
Null | The number and percentage of values in the column that are null, excluding empty values. |
Not Ok | The number and percentage of values in the column with identified quality issues like leading or trailing whitespaces, or embedded new lines. |
Empty | The number and percentage of values in the column that contain strings with no values. |
Max | The largest value in the column. |
Min | The smallest value in the column. |
Lower Quartile | The median value in the lower (first) half of the data. |
Upper Quartile | The median value in the upper (second) half of the data. |
Average | The average value of all values in the column. |
Standard Deviation | The measure of how dispersed the values in the column are. |
Sum | The sum of values in the column. |
Median | The median value of the data in the column. |
Variance | The measure of how far a set of random numbers in the column is dispersed from the mean. |
If the selected column contains date, time, and date-time values, these statistics are provided:
Type | Description |
Type | The data type of the selected column. |
Records | The number of rows in the selected column. |
Data Type Size | The amount of memory reserved for each record in this column. |
Ok | The number and percentage of values in the column with no identified quality issues, for example, leading or trailing whitespace. |
Unique | The number and percentage of unique values in the column. Use the Unique tool to see a full count of unique and duplicate entries. See Unique Tool. |
Null | The number and percentage of values in the column that are null, excluding empty values. |
Not Ok | The number and percentage of values in the column with identified quality issues like leading or trailing whitespaces, or embedded new lines. |
Empty | The number and percentage of values in the column that contain strings with no values. |
Max | The latest date value in the column. |
Min | The earliest date value in the column. |
If the selected column contains Boolean values, these statistics are provided:
Type | Description |
Type | The data type of the selected column. |
Records | The number of rows in the selected column. |
Data Type Size | The amount of memory reserved for each record in this column. |
Ok | The number and percentage of values in the column with no identified quality issues, for example, leading or trailing whitespace. |
Null | The number and percentage of values in the column that are null, excluding empty values. |
Not Ok | The number and percentage of values in the column with identified quality issues like leading or trailing whitespaces, or embedded new lines. |
Empty | The number and percentage of values in the column that contain strings with no values. |
The Basic Data Profile tool provides similar metadata without charts. Use the Basic Data Profile tool to output data profile information for further analysis.
Data Profiling Limit
Data Profiling in the Browse tool is capped at 300 MB. This allows you to process very large datasets faster. For each record in the incoming dataset, we process the record and add the record size to a counter. Once the counter reaches 300 MB, we stop processing records.
It is important to note that there is no specific number of records that we can process. This depends on the dataset since a record size can range from 1 byte to a few thousand bytes. This record size is different from the file size, displayed in the Results grid and Data Profiling Holistic View. The file size is generally different since it has been compressed to optimize spacing.
In other words, 300 MB of record size is not the same as 300 MB of file size.
Convert Browse Tool to Output Tool
Convert Browse Tool to Macro Output Tool
To convert a Browse tool to a Macro Output tool...
Right-click the Browse tool in your workflow.
Select Convert To Macro Output.
Configure the tool.
You can now use the Browse tool as a Macro Output tool.
Convert Browse Tool to Output Data Tool
To convert a Browse tool to an Output Data tool...
Right-click the Browse tool in your workflow.
Select Convert To Output Data.
Configure the tool.
You can now use the Browse tool as an Output Data tool.